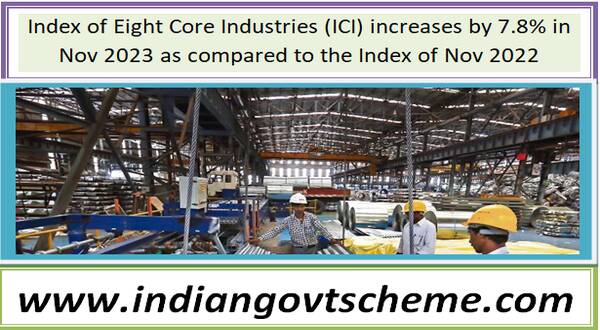
Index of Eight Core Industries (Base : 2011-12=100) for the month of November, 2021

Index of Eight Core Industries (Base : 2011-12=100) for the month of November, 2021

Ministry of Commerce & Industry

INDEX OF EIGHT CORE INDUSTRIES (BASE: 2011-12=100) FOR NOVEMBER, 2021

Posted On: 31 DEC 2021 5:00PM by PIB Delhi

The Office of Economic Adviser, Department for Promotion of Industry and Internal Trade (DPIIT) is releasing Index of Eight Core Industries (ICI) for the Month of November, 2021. ICI measures combined and individual performance of production in selected eight core industries viz. Coal, Crude Oil, Natural Gas, Refinery Products, Fertilizers, Steel, Cement and Electricity. The Eight Core Industries comprise 40.27 percent of the weight of items included in the Index of Industrial Production (IIP). Details of yearly and monthly indices and growth rates are provided at Annex I & II respectively.

The combined Index of Eight Core Industries stood at 131.7 in November 2021, which increased by 3.1 per cent (provisional) as compared to the Index of November 2020. The production of Coal, Natural Gas, Refinery Products, Fertilizers, Steel and Electricity industries increased in November 2021 over the corresponding period of last year.

Index of Eight Core Industries month of November

Final growth rate of Index of Eight Core Industries for August 2021 is revised to 12.2% from its provisional level 11.6%. The growth rate of ICI during April-November 2021-22 was 13.7% (P) as compared to the corresponding period of last FY.

The summary of the Index of Eight Core Industries is given below:

Coal – Coal production (weight: 10.33 per cent) increased by 8.2 per cent in November, 2021 over November, 2020. Its cumulative index increased by 11.6 per cent during April to November, 2021-22 over corresponding period of the previous year.

Crude Oil – Crude Oil production (weight: 8.98 per cent) declined by 2.2 per cent in November, 2021 over November, 2020. Its cumulative index declined by 2.7 per cent during April to November, 2021-22 over the corresponding period of previous year.

Natural Gas – Natural Gas production (weight: 6.88 per cent) increased by 23.7 per cent in November, 2021 over November, 2020. Its cumulative index increased by 22.8 per cent during April to November, 2021-22 over the corresponding period of previous year.

Petroleum Refinery Products – Petroleum Refinery production (weight: 28.04 per cent) increased by 4.3 per cent in November, 2021 over November, 2020. Its cumulative index increased by 10.6 per cent during April to November, 2021-22 over the corresponding period of previous year.

Fertilizers – Fertilizers production (weight: 2.63 per cent) increased by 2.5 per cent in November, 2021 over November, 2020. Its cumulative index decreased by 0.6 per cent during April to November, 2021-22 over the corresponding period of previous year.

Steel – Steel production (weight: 17.92 per cent) increased by 0.8 per cent in November, 2021 over November, 2020. Its cumulative index increased by 25.3 per cent during April to November, 2021-22 over the corresponding period of previous year.

Cement – Cement production (weight: 5.37 per cent) decreased by 3.2 per cent in November, 2021 over November, 2020. Its cumulative index increased by 28.3 per cent during April to November, 2021-22 over the corresponding period of previous year.

Electricity – Electricity generation (weight: 19.85 per cent) increased by 1.5 per cent in November, 2021 over November, 2020. Its cumulative index increased by 10.2 per cent during April to November, 2021-22 over the corresponding period of previous year.

Note 1: Data for September, 2021, October, 2021 and November, 2021 are provisional.
Note 2: Since April, 2014, Electricity generation data from Renewable sources are also included.
Note 3: The industry-wise weights indicated above are individual industry weight derived from IIP and blown up on pro rata basis to a combined weight of ICI equal to 100.
Note 4: Since March 2019, a new steel product called Hot Rolled Pickled and Oiled (HRPO) under the item ‘Cold Rolled (CR) coils’ within the production of finished steel has also been included.
Note 5: Release of the index for December, 2021 will be on Monday 31st January, 2022.

Annex I

Performance of Eight Core Industries

Yearly Index & Growth Rate

Base Year: 2011-12=100

Index

Sector

Weight

2012-13

2013-14

2014-15

2015-16

2016-17

2017-18

2018-19

2019-20

2020-21

Apr-Nov 2020-21

Apr-Nov 2021-22*

Coal

10.3335

103.2

104.2

112.6

118.0

121.8

124.9

134.1

133.6

131.1

110.2

123.0

Crude Oil

8.9833

99.4

99.2

98.4

97.0

94.5

93.7

89.8

84.5

80.1

80.4

78.2

Natural Gas

6.8768

85.6

74.5

70.5

67.2

66.5

68.4

69.0

65.1

59.8

58.4

71.7

Refinery Products

28.0376

107.2

108.6

108.8

114.1

119.7

125.2

129.1

129.4

114.9

108.9

120.5

Fertilizers

2.6276

96.7

98.1

99.4

106.4

106.6

106.6

107.0

109.8

111.6

113.5

112.8

Steel

17.9166

107.9

115.8

121.7

120.2

133.1

140.5

147.7

152.6

139.4

125.3

157.0

Cement

5.3720

107.5

111.5

118.1

123.5

122.0

129.7

147.0

145.7

130.0

114.2

146.5

Electricity

19.8530

104.0

110.3

126.6

133.8

141.6

149.2

156.9

158.4

157.6

154.4

170.1

Overall Index

100.0000

103.8

106.5

111.7

115.1

120.5

125.7

131.2

131.6

123.2

115.4

131.2


*Provisional

Growth Rates (on Y-o-Y basis in per cent)

Sector

Weight

2012-13

2013-14

2014-15

2015-16

2016-17

2017-18

2018-19

2019-20

2020-21

Apr-Nov 2020-21

Apr-Nov 2021-22*

Coal

10.3335

3.2

1.0

8.0

4.8

3.2

2.6

7.4

-0.4

-1.9

-2.6

11.6

Crude Oil

8.9833

-0.6

-0.2

-0.9

-1.4

-2.5

-0.9

-4.1

-5.9

-5.2

-6.0

-2.7

Natural Gas

6.8768

-14.4

-12.9

-5.3

-4.7

-1.0

2.9

0.8

-5.6

-8.2

-12.1

22.8

Refinery Products

28.0376

7.2

1.4

0.2

4.9

4.9

4.6

3.1

0.2

-11.2

-14.9

10.6

Fertilizers

2.6276

-3.3

1.5

1.3

7.0

0.2

0.03

0.3

2.7

1.7

3.8

-0.6

Steel

17.9166

7.9

7.3

5.1

-1.3

10.7

5.6

5.1

3.4

-8.7

-18.2

25.3

Cement

5.3720

7.5

3.7

5.9

4.6

-1.2

6.3

13.3

-0.9

-10.8

-19.5

28.3

Electricity

19.8530

4.0

6.1

14.8

5.7

5.8

5.3

5.2

0.9

-0.5

-4.6

10.2

Overall Growth

100.0000

3.8

2.6

4.9

3.0

4.8

4.3

4.4

0.4

-6.4

-11.1

13.7

*Provisional, YoY is calculated over the corresponding financial year of previous year

Annex II

Performance of Eight Core Industries

Monthly Index & Growth Rate

Base Year: 2011-12=100

Index

Sector

Coal

Crude Oil

Natural Gas

Refinery Products

Fertilizers

Steel

Cement

Electricity

Overall Index

Weight

10.3335

8.9833

6.8768

28.0376

2.6276

17.9166

5.3720

19.8530

100.0000

Nov-20

137.9

78.3

58.4

126.5

118.5

156.0

132.1

144.8

127.7

Dec-20

156.2

80.5

60.8

126.9

117.0

170.9

147.8

157.9

136.1

Jan-21

161.6

81.1

64.0

130.9

117.5

168.1

154.6

164.2

139.2

Feb-21

163.6

73.2

57.7

114.8

103.9

156.3

160.9

153.9

129.6

Mar-21

210.3

82.4

67.5

134.4

93.4

175.2

182.5

180.0

150.8

Apr-21

113.5

78.5

66.7

123.4

88.3

160.0

159.0

174.0

132.0

May-21

117.1

76.8

68.7

117.7

102.5

149.4

131.1

161.9

125.4

Jun-21

112.1

78.2

70.0

113.2

116.9

153.1

148.2

169.1

127.2

Jul-21

119.2

80.3

72.8

122.2

120.1

155.2

154.3

184.7

134.7

Aug-21

118.4

79.4

73.7

115.5

117.0

161.1

148.8

188.7

134.2

Sep-21*

114.0

77.0

73.3

112.7

113.6

154.1

141.1

167.9

126.9

Oct-21*

140.4

79.2

76.3

127.5

122.9

165.5

161.9

167.3

137.4

Nov-21*

149.2

76.6

72.2

131.9

121.4

157.3

127.8

147.0

131.7

*Provisional

Growth Rates (on Y-o-Y basis in per cent)

Sector

Coal

Crude Oil

Natural Gas

Refinery Products

Fertilizers

Steel

Cement

Electricity

Overall Growth

Weight

10.3335

8.9833

6.8768

28.0376

2.6276

17.9166

5.3720

19.8530

100.0000

Nov-20

3.3

-4.9

-9.3

-4.8

1.6

0.7

-7.3

3.5

-1.1

Dec-20

2.2

-3.6

-7.2

-2.8

-2.9

3.5

-7.2

5.1

0.4

Jan-21

-1.9

-4.6

-2.1

-2.6

0.8

8.2

-5.8

5.5

1.3

Feb-21

-4.4

-3.2

-1.0

-10.9

-3.7

2.2

0.2

0.2

-3.3

Mar-21

0.3

-3.1

12.3

-0.7

-5.0

31.5

40.6

22.5

12.6

Apr-21

9.5

-2.1

25.0

30.9

3.9

494.8

606.6

38.5

62.6

May-21

7.0

-6.3

20.1

15.3

-9.6

55.1

11.7

7.5

16.4

Jun-21

7.4

-1.8

20.6

2.4

2.0

25.2

7.5

8.2

9.4

Jul-21

18.8

-3.2

19.0

6.7

0.6

9.4

21.7

11.0

9.9

Aug-21

20.6

-2.3

20.7

9.1

-3.1

6.9

36.3

16.0

12.2

Sep-21*

8.0

-1.7

27.5

6.0

0.04

2.8

11.3

0.9

4.5

Oct-21*

14.7

-2.2

25.8

14.4

0.04

4.5

14.5

3.2

8.4

Nov-21*

8.2

-2.2

23.7

4.3

2.5

0.8

-3.2

1.5

3.1

*Provisional, YoY is calculated over the corresponding month of previous year


नोट :- हमारे वेबसाइट www.indiangovtscheme.com पर ऐसी जानकारी रोजाना आती रहती है, तो आप ऐसी ही सरकारी योजनाओं की जानकारी पाने के लिए हमारे वेबसाइट www.indiangovtscheme.com से जुड़े रहे।

*****

Index of Eight Core Industries (Base : 2011 -12=100) for the month of September 2021

Index of Eight Core Industries (Base : 2011 -12=100) for the month of September 2021

 Ministry of Commerce & Industry

INDEX OF EIGHT CORE INDUSTRIES (BASE: 2011-12=100) FOR SEPTEMBER, 2021

Posted On: 29 OCT 2021 5:00PM by PIB Delhi

The Office of Economic Adviser, Department for Promotion of Industry and Internal Trade is releasing Index of Eight Core Industries (ICI) for the Month of September, 2021.ICI measures combined and individual performance of production in selected eight core industries viz. Coal, Crude Oil, Natural Gas, Refinery Products, Fertilizers, Steel, Cement and Electricity. The Eight Core Industries comprise 40.27 percent of the weight of items included in the Index of Industrial Production (IIP). Details of yearly and monthly indices and growth rates are provided at Annex I & II respectively.

The combined Index of Eight Core Industries stood at 126.7 in September 2021, which increased by4.4 per cent (provisional) as compared to the Index of September 2020. The production of Coal, Natural Gas, Refinery Products, Fertilizers, Steel, Cement and Electricity industries increased in September 2021 over the corresponding period of last year.

Index of Eight Core Industries September

Final growth rate of Index of Eight Core Industries for June 2021 is revised to 9.4%from its provisional level 8.9%. The growth rate of ICI during April-September2021-22 was 16.6% (P) as compared to the corresponding period of last FY.

The summary of the Index of Eight Core Industries is given below:

Coal –Coal production (weight: 10.33 per cent) increased by 8.1 per cent in September,2021 over September, 2020. Its cumulative index increased by 11.7 per cent during April to September,2021-22 over corresponding period of the previous year.

Crude Oil–Crude Oil production (weight: 8.98 per cent) declined by 1.7 per cent in September, 2021 over September, 2020. Its cumulative index declined by 2.9 per cent during April to September, 2021-22over the corresponding period of previous year.

Natural Gas – Natural Gas production (weight: 6.88 per cent) increased by 27.5 per cent in September, 2021over September, 2020. Its cumulative index increased by 22.1 per cent during April to September, 2021-22 over the corresponding period of previous year.

Petroleum Refinery Products–Petroleum Refinery production (weight: 28.04 per cent) increased by 6.0 per cent in September, 2021 over September, 2020. Its cumulative index increased by 11.2 per cent during April to September, 2021-22over the corresponding period of previous year.

Fertilizers – Fertilizers production (weight: 2.63 per cent) increased by0.02 per cent in September, 2021 over September, 2020. Its cumulative index decreased by 1.3 per cent during April to September, 2021-22 over the corresponding period of previous year.

Steel –Steel production (weight: 17.92 per cent)increased by 3.0 per cent in September, 2021 over September, 2020. Its cumulative index increased by 35.0 per cent during April to September, 2021-22 over the corresponding period of previous year.

Cement –Cement production (weight: 5.37 per cent) increased by 10.8 per cent in September, 2021 over September, 2020. Its cumulative index increased by 37.7 per cent during April to September, 2021-22 over the corresponding period of previous year.

Electricity –Electricity generation (weight: 19.85 per cent) increased by 0.3per cent in September, 2021 over September,2020. Its cumulative index increased by 12.7 per cent during April to September, 2021-22 over the corresponding period of previous year.

Note 1: Data for July, 2021, August, 2021 and September, 2021 are provisional.
Note 2: Since April, 2014, Electricity generation data from Renewable sources are also included.
Note 3: The industry-wise weights indicated above are individual industry weight derived from IIP and blown up on pro rata basis to a combined weight of ICI equal to 100.
Note 4: Since March 2019, a new steel product called Hot Rolled Pickled and Oiled (HRPO) under the item ‘Cold Rolled (CR) coils’ within the production of finished steel has also been included.
Note 5: Release of the index for October,2021 will be on Tuesday30th November, 2021.

Annex I

Performance of Eight Core Industries

Yearly Index & Growth Rate

Base Year: 2011-12=100

Index

Sector

Weight

2012-13

2013-14

2014-15

2015-16

2016-17

2017-18

2018-19

2019-20

2020-21

Apr- Sep 2020-21

Apr- Sep 2021-22*

Coal

10.3335

103.2

104.2

112.6

118.0

121.8

124.9

134.1

133.6

131.1

103.6

115.7

Crude Oil

8.9833

99.4

99.2

98.4

97.0

94.5

93.7

89.8

84.5

80.1

80.7

78.4

Natural Gas

6.8768

85.6

74.5

70.5

67.2

66.5

68.4

69.0

65.1

59.8

58.1

70.9

Refinery Products

28.0376

107.2

108.6

108.8

114.1

119.7

125.2

129.1

129.4

114.9

105.6

117.4

Fertilizers

2.6276

96.7

98.1

99.4

106.4

106.6

106.6

107.0

109.8

111.6

111.1

109.7

Steel

17.9166

107.9

115.8

121.7

120.2

133.1

140.5

147.7

152.6

139.4

114.7

154.8

Cement

5.3720

107.5

111.5

118.1

123.5

122.0

129.7

147.0

145.7

130.0

106.7

147.0

Electricity

19.8530

104.0

110.3

126.6

133.8

141.6

149.2

156.9

158.4

157.6

154.6

174.2

Overall Index

100.00

103.8

106.5

111.7

115.1

120.5

125.7

131.2

131.6

123.2

111.5

129.9

*Provisional

Growth Rates (on Y-o-Y basis in per cent)

Sector

Weight

2012-13

2013-14

2014-15

2015-16

2016-17

2017-18

2018-19

2019-20

2020-21

Apr-Sep 2020-21

Apr- Sep 2021-22*

Coal

10.3335

3.2

1.0

8.0

4.8

3.2

2.6

7.4

-0.4

-1.9

-6.1

11.7

Crude Oil

8.9833

-0.6

-0.2

-0.9

-1.4

-2.5

-0.9

-4.1

-5.9

-5.2

-6.1

-2.9

Natural Gas

6.8768

-14.4

-12.9

-5.3

-4.7

-1.0

2.9

0.8

-5.6

-8.2

-13.2

22.1

Refinery Products

28.0376

7.2

1.4

0.2

4.9

4.9

4.6

3.1

0.2

-11.2

-16.3

11.2

Fertilizers

2.6276

-3.3

1.5

1.3

7.0

0.2

0.03

0.3

2.7

1.7

3.7

-1.3

Steel

17.9166

7.9

7.3

5.1

-1.3

10.7

5.6

5.1

3.4

-8.7

-25.2

35.0

Cement

5.3720

7.5

3.7

5.9

4.6

-1.2

6.3

13.3

-0.9

-10.8

-25.1

37.7

Electricity

19.8530

4.0

6.1

14.8

5.7

5.8

5.3

5.2

0.9

-0.5

-8.0

12.7

Overall Growth

100.00

3.8

2.6

4.9

3.0

4.8

4.3

4.4

0.4

-6.4

-14.5

16.6

*Provisional, YoY is calculated over the corresponding financial year of previous year

Annex II

Performance of Eight Core Industries

Monthly Index & Growth Rate

Base Year: 2011-12=100

Index

Sector

Coal

Crude Oil

Natural Gas

Refinery Products

Fertilizers

Steel

Cement

Electricity

Overall Index

Weight

10.3335

8.9833

6.8768

28.0376

2.6276

17.9166

5.3720

19.8530

100.00

Sep-20

105.6

78.3

57.5

106.3

113.5

149.9

126.8

166.4

121.4

Oct-20

122.4

80.9

60.6

111.5

122.8

158.4

141.3

162.2

126.7

Nov-20

137.9

78.3

58.4

126.5

118.5

156.0

132.1

144.8

127.7

Dec-20

156.2

80.5

60.8

126.9

117.0

170.9

147.8

157.9

136.1

Jan-21

161.6

81.1

64.0

130.9

117.5

168.1

154.6

164.2

139.2

Feb-21

163.6

73.2

57.7

114.8

103.9

156.3

160.9

153.9

129.6

Mar-21

210.3

82.4

67.5

134.4

93.4

175.2

182.5

180.0

150.8

Apr-21

113.5

78.5

66.7

123.4

88.3

160.0

159.0

174.0

132.0

May-21

117.1

76.8

68.7

117.7

102.5

149.4

131.1

161.9

125.4

Jun-21

112.1

78.2

70.0

113.2

116.9

153.1

148.2

169.1

127.2

Jul-21*

119.2

80.3

72.8

122.2

120.1

155.2

154.3

184.7

134.7

Aug-21*

118.4

79.4

73.7

115.5

117.0

156.6

148.8

188.7

133.4

Sep-21*

114.1

77.0

73.3

112.7

113.6

154.4

140.4

166.9

126.7

*Provisional

Growth Rates (on Y-o-Y basis in per cent)

Sector

Coal

Crude Oil

Natural Gas

Refinery Products

Fertilizers

Steel

Cement

Electricity

Overall Growth

Weight

10.3335

8.9833

6.8768

28.0376

2.6276

17.9166

5.3720

19.8530

100.00

Sep-20

21.0

-6.0

-10.6

-9.5

-0.3

6.2

-3.4

4.8

0.6

Oct-20

11.7

-6.2

-8.6

-17.0

6.3

5.9

3.2

11.2

-0.5

Nov-20

3.3

-4.9

-9.3

-4.8

1.6

0.7

-7.3

3.5

-1.1

Dec-20

2.2

-3.6

-7.2

-2.8

-2.9

3.5

-7.2

5.1

0.4

Jan-21

-1.9

-4.6

-2.1

-2.6

0.8

8.2

-5.8

5.5

1.3

Feb-21

-4.4

-3.2

-1.0

-10.9

-3.7

2.2

0.2

0.2

-3.3

Mar-21

0.3

-3.1

12.3

-0.7

-5.0

31.5

40.6

22.5

12.6

Apr-21

9.5

-2.1

25.0

30.9

3.9

494.8

606.6

38.5

62.6

May-21

7.0

-6.3

20.1

15.3

-9.6

55.1

11.7

7.5

16.4

Jun-21

7.4

-1.8

20.6

2.4

2.0

25.2

7.5

8.2

9.4

Jul-21*

18.8

-3.2

19.0

6.7

0.5

9.4

21.7

11.0

9.9

Aug-21*

20.6

-2.3

20.7

9.1

-3.1

3.9

36.3

16.0

11.5

Sep-21*

8.1

-1.7

27.5

6.0

0.02

3.0

10.8

0.3

4.4

*Provisional, YoY is calculated over the corresponding month of previous year


नोट :-
 हमारे वेबसाइट www.indiangovtscheme.com पर ऐसी जानकारी रोजाना आती रहती है, तो आप ऐसी ही सरकारी योजनाओं की जानकारी पाने के लिए हमारे वेबसाइट 
www.indiangovtscheme.com से जुड़े रहे।

*****

Index of Eight Core Industries (Base: 2011-12=100) for August, 2021

Index of Eight Core Industries (Base: 2011-12=100) for August, 2021

Ministry of Commerce & Industry

Index of Eight Core Industries (Base: 2011-12=100) for August, 2021

Posted On: 30 SEP 2021 5:00PM by PIB Delhi

The Office of Economic Adviser, Department for Promotion of Industry and Internal Trade is releasing Index of Eight Core Industries (ICI) for the Month of August, 2021. ICI measures combined and individual performance of production in selected eight core industries viz. Coal, Crude Oil, Natural Gas, Refinery Products, Fertilizers, Steel, Cement and Electricity. The Eight Core Industries comprise 40.27 percent of the weight of items included in the Index of Industrial Production (IIP). Details of yearly and monthly indices and growth rates are provided at Annex I & II respectively.

The combined Index of Eight Core Industries stood at 133.5 in August 2021, which increased by11.6 per cent (provisional) as compared to the Index of August 2020. The production of Coal, Natural Gas, Refinery Products, Steel, Cement and Electricity industries increased in August 2021 over the corresponding period of last year.

Index of Eight Core Industries

Final growth rate of Index of Eight Core Industries for May 2021 is revised to 16.4%from its provisional level 16.8%. The growth rate of ICI during April-August 2021-22 was 19.3% (P) as compared to the corresponding period of last FY.

The summary of the Index of Eight Core Industries is given below:

Coal –Coal production (weight: 10.33 per cent) increased by 20.6 per cent in August,2021 over August,2020. Its cumulative index increased by 12.5 per cent during April to August,2021-22 over corresponding period of the previous year.

Crude Oil–Crude Oil production (weight: 8.98 per cent) declined by 2.3 per cent in August, 2021 overAugust,2020. Its cumulative index declined by 3.2 per cent during April to August, 2021-22over the corresponding period of previous year.

Natural Gas – Natural Gas production (weight: 6.88 per cent) increased by 20.6 per cent in August, 2021over August, 2020. Its cumulative index increased by 21.0 per cent during April to August, 2021-22 over the corresponding period of previous year.

Petroleum Refinery Products–Petroleum Refinery production (weight: 28.04 per cent) increased by 9.1 per centin August, 2021 over August, 2020. Its cumulative index increased by 12.3 per cent during April to August, 2021-22over the corresponding period of previous year.

Fertilizers – Fertilizers production (weight: 2.63 per cent) declined by 3.1 per cent in August, 2021 over August, 2020. Its cumulative index decreased by 1.5 per cent during April to August, 2021-22 over the corresponding period of previous year.

Steel –Steel production (weight: 17.92 per cent)increased by 5.1 per cent in August, 2021 over August, 2020. Its cumulative index increased by 44.2 per cent during April to August, 2021-22 over the corresponding period of previous year.

Cement –Cement production (weight: 5.37 per cent) increased by 36.3 per cent in August, 2021 over August, 2020. Its cumulative index increased by 44.3 per cent during April to August, 2021-22 over the corresponding period of previous year.

Electricity –Electricity generation (weight: 19.85 per cent) increased by 15.3per cent in August, 2021 over August,2020. Its cumulative index increased by 15.2 per cent during April to August, 2021-22 over the corresponding period of previous year.

Note 1: Data for June, 2021, July, 2021 and August, 2021 are provisional.

Note 2: Since April, 2014, Electricity generation data from Renewable sources are also included.

Note 3: The industry-wise weights indicated above are individual industry weight derived from IIP and blown up on pro rata basis to a combined weight of ICI equal to 100.

Note 4: Since March 2019, a new steel product called Hot Rolled Pickled and Oiled (HRPO) under the item ‘Cold Rolled (CR) coils’ within the production of finished steel has also been included.

Note 5: Release of the index for September,2021 will be on Friday29th October, 2021.

Annex I
Performance of Eight Core Industries

Yearly Index & Growth Rate

Base Year: 2011-12=100

Index

Sector

Weight

2012-13

2013-14

2014-15

2015-16

2016-17

2017-18

2018-19

2019-20

2020-21

Apr- Aug 2020-21

Apr- Aug 2021-22*

Coal

10.3335

103.2

104.2

112.6

118.0

121.8

124.9

134.1

133.6

131.1

103.2

116.1

Crude Oil

8.9833

99.4

99.2

98.4

97.0

94.5

93.7

89.8

84.5

80.1

81.2

78.6

Natural Gas

6.8768

85.6

74.5

70.5

67.2

66.5

68.4

69.0

65.1

59.8

58.2

70.4

Refinery Products

28.0376

107.2

108.6

108.8

114.1

119.7

125.2

129.1

129.4

114.9

105.5

118.4

Fertilizers

2.6276

96.7

98.1

99.4

106.4

106.6

106.6

107.0

109.8

111.6

110.6

109.0

Steel

17.9166

107.9

115.8

121.7

120.2

133.1

140.5

147.7

152.6

139.4

107.6

155.2

Cement

5.3720

107.5

111.5

118.1

123.5

122.0

129.7

147.0

145.7

130.0

102.7

148.3

Electricity

19.8530

104.0

110.3

126.6

133.8

141.6

149.2

156.9

158.4

157.6

152.3

175.5

Overall Index

100.00

103.8

106.5

111.7

115.1

120.5

125.7

131.2

131.6

123.2

109.5

130.5

*Provisional

Growth Rates (on Y-o-Y basis in per cent)

Sector

Weight

2012-13

2013-14

2014-15

2015-16

2016-17

2017-18

2018-19

2019-20

2020-21

Apr-Aug 2020-21

Apr- Aug 2021-22*

Coal

10.3335

3.2

1.0

8.0

4.8

3.2

2.6

7.4

-0.4

-1.9

-10.2

12.5

Crude Oil

8.9833

-0.6

-0.2

-0.9

-1.4

-2.5

-0.9

-4.1

-5.9

-5.2

-6.1

-3.2

Natural Gas

6.8768

-14.4

-12.9

-5.3

-4.7

-1.0

2.9

0.8

-5.6

-8.2

-13.7

21.0

Refinery Products

28.0376

7.2

1.4

0.2

4.9

4.9

4.6

3.1

0.2

-11.2

-17.5

12.3

Fertilizers

2.6276

-3.3

1.5

1.3

7.0

0.2

0.03

0.3

2.7

1.7

4.6

-1.5

Steel

17.9166

7.9

7.3

5.1

-1.3

10.7

5.6

5.1

3.4

-8.7

-30.9

44.2

Cement

5.3720

7.5

3.7

5.9

4.6

-1.2

6.3

13.3

-0.9

-10.8

-29.0

44.3

Electricity

19.8530

4.0

6.1

14.8

5.7

5.8

5.3

5.2

0.9

-0.5

-10.4

15.2

Overall Growth

100.00

3.8

2.6

4.9

3.0

4.8

4.3

4.4

0.4

-6.4

-17.3

19.3

*Provisional, YoY is calculated over the corresponding financial year of previous year

Annex II

Performance of Eight Core Industries

Monthly Index & Growth Rate

Base Year: 2011-12=100

Index

Sector

Coal

Crude Oil

Natural Gas

Refinery Products

Fertilizers

Steel

Cement

Electricity

Overall Index

Weight

10.3335

8.9833

6.8768

28.0376

2.6276

17.9166

5.3720

19.8530

100.00

Aug-20

98.2

81.2

61.0

105.9

120.8

150.7

109.1

162.7

119.7

Sep-20

105.6

78.3

57.5

106.3

113.5

149.9

126.8

166.4

121.4

Oct-20

122.4

80.9

60.6

111.5

122.8

158.4

141.3

162.2

126.7

Nov-20

137.9

78.3

58.4

126.5

118.5

156.0

132.1

144.8

127.7

Dec-20

156.2

80.5

60.8

126.9

117.0

170.9

147.8

157.9

136.1

Jan-21

161.6

81.1

64.0

130.9

117.5

168.1

154.6

164.2

139.2

Feb-21

163.6

73.2

57.7

114.8

103.9

156.3

160.9

153.9

129.6

Mar-21

210.3

82.4

67.5

134.4

93.4

175.2

182.5

180.0

150.8

Apr-21

113.5

78.5

66.7

123.4

88.3

160.0

159.0

174.0

132.0

May-21

117.1

76.8

68.7

117.7

102.5

149.4

131.1

161.9

125.4

Jun-21*

112.1

78.2

70.0

113.2

116.9

152.8

148.2

169.1

127.1

Jul-21*

119.2

80.3

72.8

122.2

120.1

155.2

154.3

184.7

134.7

Aug-21*

118.4

79.3

73.6

115.5

117.0

158.3

148.7

187.7

133.5

*Provisional

Growth Rates (on Y-o-Y basis in per cent)

Sector

Coal

Crude Oil

Natural Gas

Refinery Products

Fertilizers

Steel

Cement

Electricity

Overall Growth

Weight

10.3335

8.9833

6.8768

28.0376

2.6276

17.9166

5.3720

19.8530

100.00

Aug-20

3.6

-6.3

-9.5

-19.1

7.3

0.5

-14.5

-1.8

-6.9

Sep-20

21.0

-6.0

-10.6

-9.5

-0.3

6.2

-3.4

4.8

0.6

Oct-20

11.7

-6.2

-8.6

-17.0

6.3

5.9

3.2

11.2

-0.5

Nov-20

3.3

-4.9

-9.3

-4.8

1.6

0.7

-7.3

3.5

-1.1

Dec-20

2.2

-3.6

-7.2

-2.8

-2.9

3.5

-7.2

5.1

0.4

Jan-21

-1.9

-4.6

-2.1

-2.6

0.8

8.2

-5.8

5.5

1.3

Feb-21

-4.4

-3.2

-1.0

-10.9

-3.7

2.2

0.2

0.2

-3.3

Mar-21

0.3

-3.1

12.3

-0.7

-5.0

31.5

40.6

22.5

12.6

Apr-21

9.5

-2.1

25.0

30.9

3.9

494.8

606.6

38.5

62.6

May-21

7.0

-6.3

20.1

15.3

-9.6

55.1

11.7

7.5

16.4

Jun-21*

7.4

-1.8

20.6

2.4

2.0

24.9

7.5

8.2

9.3

Jul-21*

18.8

-3.2

19.0

6.7

0.5

9.4

21.7

11.0

9.9

Aug-21*

20.6

-2.3

20.6

9.1

-3.1

5.1

36.3

15.3

11.6

*Provisional, YoY is calculated over the corresponding month of previous year
Source: PIB

नोट :- हमारे वेबसाइट www.indiangovtscheme.com पर ऐसी जानकारी रोजाना आती रहती है, तो आप ऐसी ही सरकारी योजनाओं की जानकारी पाने के लिए हमारे वेबसाइट www.indiangovtscheme.com से जुड़े रहे।

*****

Index of Eight Core Industries (Base 2011-12=100) for May 2021

Index of Eight Core Industries (Base 2011-12=100) for May 2021

 Ministry of Commerce & Industry

INDEX OF EIGHT CORE INDUSTRIES (BASE: 2011-12=100) FOR MAY, 2021

Posted On: 30 JUN 2021 5:00PM by PIB Delhi

The Office of Economic Adviser, Department for Promotion of Industry and Internal Trade is releasing Index of Eight Core Industries (ICI) for the Month of May, 2021. ICI measures combined and individual performance of production in selected eight core industries viz. Coal, Crude Oil, Natural Gas, Refinery Products, Fertilizers, Steel, Cement and Electricity. The Eight Core Industries comprise 40.27 percent of the weight of items included in the Index of Industrial Production (IIP).  Details of yearly and monthly indices and growth rates are provided at Annex I & II respectively.

The combined Index of Eight Core Industries stood at 125.8 in May 2021, which increased by 16.8 per cent (provisional) as compared to the Index of May 2020. The production of Coal, Natural Gas, Refinery Products, Steel, Cement and Electricity industries increased in May 2021 over the corresponding period of last year.

Index of Eight Core Industries may 2o21

Final growth rate of Index of Eight Core Industries for February 2021 is revised to (-) 3.3% from its provisional level (-) 4.6%. The growth rate of ICI during April-May 2021-22 was 35.8% (P) as compared to the corresponding period of last FY.

The summary of the Index of Eight Core Industries is given below:

Coal – Coal production (weight: 10.33 per cent) increased by 6.9 per cent in May, 2021 over May, 2020. Its cumulative index increased by 8.2 per cent during April to May, 2021-22 over corresponding period of the previous year.

Crude Oil – Crude Oil production (weight: 8.98 per cent) declined by 6.3 per cent in May, 2021 over May, 2020. Its cumulative index declined by 4.2 per cent during April to May, 2021-22 over the corresponding period of previous year.

Natural Gas – Natural Gas production (weight: 6.88 per cent) increased by 20.1 per cent in May, 2021 over May, 2020. Its cumulative index increased by 22.5 per cent during April to May, 2021-22 over the corresponding period of previous year.

Petroleum Refinery Products – Petroleum Refinery production (weight: 28.04 per cent) increased by 15.3 per cent in May, 2021 over May, 2020. Its cumulative index increased by 22.8 per cent during April to May, 2021-22 over the corresponding period of previous year.

Fertilizers – Fertilizers production (weight: 2.63 per cent) decreased by 9.6 per cent in May, 2021 over May, 2020. Its cumulative index decreased by 3.9 per cent during April to May, 2021-22 over the corresponding period of previous year.

Steel – Steel production (weight: 17.92 per cent) increased by 59.3 per cent in May, 2021 over May, 2020. Its cumulative index increased by 149.5 per cent during April to May, 2021-22 over the corresponding period of previous year.

Cement – Cement production (weight: 5.37 per cent) increased by 7.9 per cent in May, 2021 over May, 2020. Its cumulative index increased by 100.4 per cent during April to May, 2021-22 over the corresponding period of previous year.

Electricity – Electricity generation (weight: 19.85 per cent) increased by 7.3 per cent in May, 2021 over May, 2020. Its cumulative index increased by 21.5 per cent during April to May, 2021-22 over the corresponding period of previous year.

Note 1: Data for March, 2021, April, 2021 and May, 2021 are provisional.
Note 2: Since April, 2014, Electricity generation data from Renewable sources are also included.
Note 3: The industry-wise weights indicated above are individual industry weight derived from IIP and blown up on pro rata basis to a combined weight of ICI equal to 100.
Note 4: Since March 2019, a new steel product called Hot Rolled Pickled and Oiled (HRPO) under the item ‘Cold Rolled (CR) coils’ within the production of finished steel has also been included.
Note 5: Release of the index for June, 2021 will be on Friday 30th July, 2021.

Annex I

Performance of Eight Core Industries
Yearly Index & Growth Rate
Base Year: 2011-12=100

Index

Sector

Weight

2012-13

2013-14

2014-15

2015-16

2016-17

2017-18

2018-19

2019-20

2020-21*

Apr- May 2020-21

Apr- May 2021-22*

Coal

10.3335

103.2

104.2

112.6

118.0

121.8

124.9

134.1

133.6

131.1

106.5

115.2

Crude Oil

8.9833

99.4

99.2

98.4

97.0

94.5

93.7

89.8

84.5

80.1

81.1

77.7

Natural Gas

6.8768

85.6

74.5

70.5

67.2

66.5

68.4

69.0

65.1

59.8

55.3

67.7

Refinery Products

28.0376

107.2

108.6

108.8

114.1

119.7

125.2

129.1

129.4

114.9

98.1

120.5

Fertilizers

2.6276

96.7

98.1

99.4

106.4

106.6

106.6

107.0

109.8

111.5

99.2

95.4

Steel

17.9166

107.9

115.8

121.7

120.2

133.1

140.5

147.7

152.6

138.9

61.6

153.8

Cement

5.3720

107.5

111.5

118.1

123.5

122.0

129.7

147.0

145.7

129.1

69.9

140.2

Electricity

19.8530

104.0

110.3

126.6

133.8

141.6

149.2

156.9

158.4

157.6

138.1

167.8

Overall Index

100.00

103.8

106.5

111.7

115.1

120.5

125.7

131.2

131.6

123.1

94.4

128.2

*Provisional

Growth Rates (on Y-o-Y basis in per cent)

Sector

Weight

2012-13

2013-14

2014-15

2015-16

2016-17

2017-18

2018-19

2019-20

2020-21*

Apr- May 2020-21

Apr- May 2021-22*

Coal

10.3335

3.2

1.0

8.0

4.8

3.2

2.6

7.4

-0.4

-1.9

-14.7

8.2

Crude Oil

8.9833

-0.6

-0.2

-0.9

-1.4

-2.5

-0.9

-4.1

-5.9

-5.2

-6.7

-4.2

Natural Gas

6.8768

-14.4

-12.9

-5.3

-4.7

-1.0

2.9

0.8

-5.6

-8.2

-18.3

22.5

Refinery Products

28.0376

7.2

1.4

0.2

4.9

4.9

4.6

3.1

0.2

-11.2

-22.7

22.8

Fertilizers

2.6276

-3.3

1.5

1.3

7.0

0.2

0.03

0.3

2.7

1.5

2.0

-3.9

Steel

17.9166

7.9

7.3

5.1

-1.3

10.7

5.6

5.1

3.4

-9.0

-61.3

149.5

Cement

5.3720

7.5

3.7

5.9

4.6

-1.2

6.3

13.3

-0.9

-11.4

-53.7

100.4

Electricity

19.8530

4.0

6.1

14.8

5.7

5.8

5.3

5.2

0.9

-0.5

-18.7

21.5

Overall Growth

100.00

3.8

2.6

4.9

3.0

4.8

4.3

4.4

0.4

-6.5

-29.4

35.8

*Provisional, YoY is calculated over the corresponding financial year of previous year

Annex II

Performance of Eight Core Industries
Monthly Index & Growth Rate
Base Year: 2011-12=100

Index 

Sector

Coal

Crude Oil

Natural Gas

Refinery Products

Fertilizers

Steel

Cement

Electricity

Overall Index

Weight

10.3335

8.9833

6.8768

28.0376

2.6276

17.9166

5.3720

19.8530

100.00

May-20

109.4

82.0

57.2

102.0

113.4

96.4

117.3

150.6

107.7

Jun-20

104.3

79.6

58.1

110.6

114.6

122.3

137.8

156.2

116.3

Jul-20

100.3

83.0

61.2

114.5

119.4

141.9

126.8

166.3

122.5

Aug-20

98.2

81.2

61.0

105.9

120.8

150.7

109.1

162.7

119.7

Sep-20

105.6

78.3

57.5

106.3

113.5

149.9

126.8

166.4

121.4

Oct-20

122.4

80.9

60.6

111.5

122.8

158.4

141.3

162.2

126.7

Nov-20

137.9

78.3

58.4

126.5

118.5

156.0

132.1

144.8

127.7

Dec-20

156.2

80.5

60.8

126.9

117.0

170.9

147.8

157.9

136.1

Jan-21

161.6

81.1

64.0

130.9

117.5

168.1

154.6

164.2

139.2

Feb-21

163.6

73.2

57.7

114.8

103.9

156.3

160.9

153.9

129.6

Mar-21*

210.3

82.4

67.4

134.4

91.3

169.6

172.1

180.0

149.2

Apr-21*

113.5

78.5

66.7

123.4

88.3

154.1

153.7

174.0

130.7

May-21*

117.0

76.8

68.7

117.7

102.5

153.5

126.7

161.6

125.8

*Provisional

Growth Rates (on Y-o-Y basis in per cent)

Sector

Coal

Crude Oil

Natural Gas

Refinery Products

Fertilizers

Steel

Cement

Electricity

Overall Growth

Weight

10.3335

8.9833

6.8768

28.0376

2.6276

17.9166

5.3720

19.8530

100.00

May-20

-14.0

-7.1

-16.8

-21.3

7.5

-40.4

-21.4

-14.8

-21.4

Jun-20

-15.5

-6.0

-12.0

-8.9

4.2

-23.2

-6.8

-10.0

-12.4

Jul-20

-5.7

-4.9

-10.2

-13.9

6.9

-6.5

-13.5

-2.4

-7.6

Aug-20

3.6

-6.3

-9.5

-19.1

7.3

0.5

-14.5

-1.8

-6.9

Sep-20

21.0

-6.0

-10.6

-9.5

-0.3

6.2

-3.4

4.8

0.6

Oct-20

11.7

-6.2

-8.6

-17.0

6.3

5.9

3.2

11.2

-0.5

Nov-20

3.3

-4.9

-9.3

-4.8

1.6

0.7

-7.3

3.5

-1.1

Dec-20

2.2

-3.6

-7.2

-2.8

-2.9

3.5

-7.2

5.1

0.4

Jan-21

-1.9

-4.6

-2.1

-2.6

0.8

8.2

-5.8

5.5

1.3

Feb-21

-4.4

-3.2

-1.0

-10.9

-3.7

2.2

0.2

0.2

-3.3

Mar-21*

0.3

-3.1

12.3

-0.7

-7.1

27.3

32.7

22.5

11.4

Apr-21*

9.5

-2.1

25.0

30.9

3.9

472.7

582.7

38.5

60.9

May-21*

6.9

-6.3

20.1

15.3

-9.6

59.3

7.9

7.3

16.8

*Provisional, YoY is calculated over the corresponding month of previous year
Source: PIB

नोट :- हमारे वेबसाइट www.indiangovtscheme.com पर ऐसी जानकारी रोजाना आती रहती है, तो आप ऐसी ही सरकारी योजनाओं की जानकारी पाने के लिए हमारे वेबसाइट www.indiangovtscheme.com से जुड़े रहे।

*****

Index of Eight Core Industries (Base: 2011-12=100) for April, 2021 : Ministry of Commerce & Industry

Index of Eight Core Industries (Base: 2011-12=100) for April, 2021 : Ministry of Commerce & Industry 

 Ministry of Commerce & Industry

Index of Eight Core Industries (BASE: 2011-12=100) for April, 2021

प्रविष्टि तिथि: 31 MAY 2021 5:00PM by PIB Delhi

The Office of Economic Adviser, Department for Promotion of Industry and Internal Trade is releasing Index of Eight Core Industries (ICI) for the Month of April, 2021. ICI measures combined and individual performance of production in selected eight core industries viz. Coal, Crude Oil, Natural Gas, Refinery Products, Fertilizers, Steel, Cement and Electricity. Eight Core Industries comprise 40.27 percent of the weight of items included in the Index of Industrial Production (IIP). Details of yearly and monthly indices and growth rate are provided at Annex I & II respectively.

The combined ICI stood at 126.7 in April 2021, which increased by 56.1per cent (provisional) as compared to the Index of April 2020. This high growth rate in April 2021 is largely due to low Index base in April 2020 consequent to the low industrial production across all sectors caused by nationwide lockdown imposed to contain spread of Covid-19 last year. The month over month production of eight core industries, as captured by ICI, declined by 15.1per cent (P) in April 2021 compared to March 2021(P) due to emergence of second wave of infectious COVID-19.

Index of Eight Core Industries for April 2021

Final growth rate of Index of Eight Core Industries for January 2021is revised to1.3%from its provisional level0.1 %.The growth rate of ICI during April-March 2020-21was (-)6.5% (P) as compared to the corresponding period of last FY.

Annual and Monthly growth rate of Index of Eight Core Industries (combined) is depicted in the table:

Annual Growth Rates (YoY)*

Monthly Growth Rate (MoM)#

Weight

Jan-21 (F)

Feb-21 (P)

Mar-21 (P)

Apr-21(P)

Jan-21 (F)

Feb-21(P)

Mar-21(P)

Apr-21(P)

Coal

10.3335

-1.9

-4.4

0.3

9.5

3.5

1.2

28.5

-46.0

Crude Oil

8.9833

-4.6

-3.2

-3.1

-2.1

0.7

-9.7

12.6

-4.6

Natural Gas

6.8768

-2.1

-1.0

12.3

25.0

5.2

-9.8

16.9

-1.1

Refinery Products

28.0376

-2.6

-10.9

-0.7

30.9

3.2

-12.3

17.0

-8.2

Fertilizers

2.6276

0.8

-3.7

-7.1

1.7

0.5

-11.6

-12.1

-5.3

Steel

17.9166

8.2

1.3

27.3

400.0

-1.7

-7.9

9.5

-20.7

Cement

5.372

-5.8

-5.6

32.7

548.8

4.6

-1.9

13.5

-15.2

Electricity

19.853

5.5

0.2

22.5

38.7

4.0

-6.3

17.0

-3.3

Overall Index

100

1.3

-3.8

11.4

56.1

2.3

-7.5

15.8

-15.1

P: Provisional, F: Final,

* Annual growth rate (Y-o-Y) is calculated over the corresponding month of previous year

#Monthly growth rate (M-o-M) is based on month over month comparison i.e. preceding month

The summary of the Index of Eight Core Industries is given below:

Coal – Monthly Coal production (weight: 10.33 per cent) decreased by 46.0 percent (P) in April 2021 compared to March 2021 (P) while year on year basis production increased by 9.5 per cent (P) in April 2021compared toApril 2020. Its cumulative index declined by 1.9 per cent (P) during April to March, 2020-21 over corresponding period of the previous year.

Crude Oil–Monthly Crude Oil production (weight: 8.98 per cent) decreased by 4.6 percent (P) in April 2021 compared to March 2021 (P)while year on year basis production declined by 2.1 per cent (P) in April 2021 compared to April 2020. Its cumulative index declined by 5.2 per cent (P) during April to March, 2020-21 over the corresponding period of previous year.

Natural Gas – Monthly Natural Gas production (weight: 6.88 per cent) decreased by 1.1 percent (P) in April 2021 compared to March 2021 (P)while year on year basis production increased by 25.0 per cent in April 2021 (P) over April 2020. Its cumulative index declined by 8.2 per cent (P) during April to March, 2020-21 over the corresponding period of previous year.

Petroleum Refinery Products–Monthly Petroleum Refinery production (weight: 28.04 per cent) decreased by 8.2 percent (P) in April 2021 compared to March 2021 (P) while year on year basis production increased by 30.9 per cent (P) in April 2021 over April 2020. Its cumulative index declined by 11.2 per cent (P) during April to March, 2020-21 over the corresponding period of previous year.

Fertilizers –Monthly Fertilizers production (weight: 2.63 per cent) decreased by 5.3 percent (P) in April 2021 compared to March 2021 (P) while year on year basis production increased by 1.7 per cent (P) in April 2021 over April 2020. Its cumulative index increased by 1.5 per cent (P) during April to March, 2020-21 over the corresponding period of previous year.

Steel –Monthly Steel production (weight: 17.92 per cent) decreased by 20.7 percent (P) in April 2021 compared to March 2021 (P) while year on year basis production increased by 400.0 per cent (P) in April 2021 over April 2020. Its cumulative index declined by 9.0 per cent (P) during April to March, 2020-21 over the corresponding period of previous year.

Cement –Monthly Cement production (weight: 5.37 per cent) decreased by 15.2 percent (P) in April 2021 compared to March 2021 (P)while year on year basis production increased by 548.8 per cent (P) in April 2021 over April 2020. Its cumulative index declined by 11.9 per cent (P) during April to March, 2020-21 over the corresponding period of previous year.

Electricity –Monthly Electricity generation (weight: 19.85 per cent) decreased by 3.3 percent (P) in April 2021 compared to March 2021 (P) while year on year basis production increased by 38.7 per cent (P) in April 2021 over April 2020. Its cumulative index declined by 0.5 per cent (P) during April to March, 2020-21 over the corresponding period of previous year.

Note 1: Data for February, 2021, March, 2021 and April, 2021 are provisional.
Note 2: Since April, 2014, Electricity generation data from Renewable sources are also included.
Note 3: The industry-wise weights indicated above are individual industry weight derived from IIP and blown up on pro rata basis to a combined weight of ICI equal to 100.
Note 4: Since March 2019, a new steel product called Hot Rolled Pickled and Oiled (HRPO) under the item ‘Cold Rolled (CR) coils’ within the production of finished steel has also been included.
Note 5: Release of the index for May, 2021 will be on Wednesday 30th June, 2021.

Annex I

Performance of Eight Core Industries

Yearly Index & Growth Rate

Base Year: 2011-12=100

Index

Sector

Weight

2012-13

2013-14

2014-15

2015-16

2016-17

2017-18

2018-19

2019-20

2020-21* (April to March)

Coal

10.3335

103.2

104.2

112.6

118.0

121.8

124.9

134.1

133.6

131.1

Crude Oil

8.9833

99.4

99.2

98.4

97.0

94.5

93.7

89.8

84.5

80.1

Natural Gas

6.8768

85.6

74.5

70.5

67.2

66.5

68.4

69.0

65.1

59.8

Refinery Products

28.0376

107.2

108.6

108.8

114.1

119.7

125.2

129.1

129.4

114.9

Fertilizers

2.6276

96.7

98.1

99.4

106.4

106.6

106.6

107.0

109.8

111.5

Steel

17.9166

107.9

115.8

121.7

120.2

133.1

140.5

147.7

152.6

138.8

Cement

5.3720

107.5

111.5

118.1

123.5

122.0

129.7

147.0

145.7

128.3

Electricity

19.8530

104.0

110.3

126.6

133.8

141.6

149.2

156.9

158.4

157.6

Overall Index

100.00

103.8

106.5

111.7

115.1

120.5

125.7

131.2

131.6

123.0

*Provisional
Growth Rates (on Y-o-Y basis in per cent)

Sector

Weight

2012-13

2013-14

2014-15

2015-16

2016-17

2017-18

2018-19

2019-20

2020-21* (April to March)

Coal

10.3335

3.2

1.0

8.0

4.8

3.2

2.6

7.4

-0.4

-1.9

Crude Oil

8.9833

-0.6

-0.2

-0.9

-1.4

-2.5

-0.9

-4.1

-5.9

-5.2

Natural Gas

6.8768

-14.4

-12.9

-5.3

-4.7

-1.0

2.9

0.8

-5.6

-8.2

Refinery Products

28.0376

7.2

1.4

0.2

4.9

4.9

4.6

3.1

0.2

-11.2

Fertilizers

2.6276

-3.3

1.5

1.3

7.0

0.2

0.03

0.3

2.7

1.5

Steel

17.9166

7.9

7.3

5.1

-1.3

10.7

5.6

5.1

3.4

-9.0

Cement

5.3720

7.5

3.7

5.9

4.6

-1.2

6.3

13.3

-0.9

-11.9

Electricity

19.8530

4.0

6.1

14.8

5.7

5.8

5.3

5.2

0.9

-0.5

Overall Growth

100.00

3.8

2.6

4.9

3.0

4.8

4.3

4.4

0.4

-6.5

*Provisional,YoY is calculated over the corresponding financial year of previous year

 Annex II

Performance of Eight Core Industries

Monthly Index & Growth Rate

Base Year: 2011-12=100

Index

Sector

Coal

Crude Oil

Natural Gas

Refinery Products

Fertilizers

Steel

Cement

Electricity

Overall Index

Weight

10.3335

8.9833

6.8768

28.0376

2.6276

17.9166

5.3720

19.8530

100.00

Apr-20

103.7

80.2

53.3

94.2

85.0

26.9

22.5

125.6

81.2

May-20

109.4

82.0

57.2

102.0

113.4

96.4

117.3

150.6

107.7

Jun-20

104.3

79.6

58.1

110.6

114.6

122.3

137.8

156.2

116.3

Jul-20

100.3

83.0

61.2

114.5

119.4

141.9

126.8

166.3

122.5

Aug-20

98.2

81.2

61.0

105.9

120.8

150.7

109.1

162.7

119.7

Sep-20

105.6

78.3

57.5

106.3

113.5

149.9

126.8

166.4

121.4

Oct-20

122.4

80.9

60.6

111.5

122.8

158.4

141.3

162.2

126.7

Nov-20

137.9

78.3

58.4

126.5

118.5

156.0

132.1

144.8

127.7

Dec-20

156.2

80.5

60.8

126.9

117.0

170.9

147.8

157.9

136.1

Jan-21

161.6

81.1

64.0

130.9

117.5

168.1

154.6

164.2

139.2

Feb-21*

163.6

73.2

57.7

114.8

103.9

154.9

151.7

153.9

128.8

Mar-21*

210.3

82.4

67.4

134.4

91.3

169.6

172.1

180.0

149.2

Apr-21*

113.5

78.5

66.7

123.4

86.4

134.5

146.0

174.1

126.7

*Provisional

 Growth Rates (on Y-o-Y basis in per cent)

Sector

Coal

Crude Oil

Natural Gas

Refinery Products

Fertilizers

Steel

Cement

Electricity

Overall Growth

Weight

10.3335

8.9833

6.8768

28.0376

2.6276

17.9166

5.3720

19.8530

100.00

Apr-20

-15.5

-6.4

-19.9

-24.2

-4.5

-82.8

-85.2

-22.9

-37.9

May-20

-14.0

-7.1

-16.8

-21.3

7.5

-40.4

-21.4

-14.8

-21.4

Jun-20

-15.5

-6.0

-12.0

-8.9

4.2

-23.2

-6.8

-10.0

-12.4

Jul-20

-5.7

-4.9

-10.2

-13.9

6.9

-6.5

-13.5

-2.4

-7.6

Aug-20

3.6

-6.3

-9.5

-19.1

7.3

0.5

-14.5

-1.8

-6.9

Sep-20

21.0

-6.0

-10.6

-9.5

-0.3

6.2

-3.4

4.8

0.6

Oct-20

11.7

-6.2

-8.6

-17.0

6.3

5.9

3.2

11.2

-0.5

Nov-20

3.3

-4.9

-9.3

-4.8

1.6

0.7

-7.3

3.5

-1.1

Dec-20

2.2

-3.6

-7.2

-2.8

-2.9

3.5

-7.2

5.1

0.4

Jan-21

-1.9

-4.6

-2.1

-2.6

0.8

8.2

-5.8

5.5

1.3

Feb-21*

-4.4

-3.2

-1.0

-10.9

-3.7

1.3

-5.6

0.2

-3.8

Mar-21*

0.3

-3.1

12.3

-0.7

-7.1

27.3

32.7

22.5

11.4

Apr-21*

9.5

-2.1

25.0

30.9

1.7

400.0

548.8

38.7

56.1

*Provisional,YoY is calculated over the corresponding month of previous year
Source: PIB

नोट :- हमारे वेबसाइट www.indiangovtscheme.com पर ऐसी जानकारी रोजाना आती रहती है, तो आप ऐसी ही सरकारी योजनाओं की जानकारी पाने के लिए हमारे वेबसाइट www.indiangovtscheme.com से जुड़े रहे। 
*****

INDEX OF EIGHT CORE INDUSTRIES (BASE: 2011-12=100) FOR MARCH, 2021

INDEX OF EIGHT CORE INDUSTRIES (BASE: 2011-12=100) FOR MARCH, 2021

Ministry of Commerce & Industry

INDEX OF EIGHT CORE INDUSTRIES (BASE: 2011-12=100) FOR MARCH, 2021

Posted On: 30 APR 2021 5:00PM by PIB Delhi

The Office of the Economic Adviser, Department for Promotion of Industry and Internal Trade is releasing Index of Eight Core Industries for the Month of March, 2021.

The combined Index of Eight Core Industries stood at 143.1 in March, 2021, which increased by 6.8 (provisional) per cent as compared to the Index of March, 2020. Its cumulative growth during April to March, 2020-21 has been (-) 7.0%.

Final growth rate of Index of Eight Core Industries for December 2020 is revised to 0.4% from its provisional level (-) 1.3%. The Eight Core Industries comprise 40.27 per cent of the weight of items included in the Index of Industrial Production (IIP). Details of yearly and monthly index and their growth rate are provided at Annexure I & II.

Monthly growth rate of Index of Eight Core Industries (Overall) is depicted in the graph: 

INDEX OF EIGHT CORE INDUSTRIES

*Provisional

The summary of the Index of Eight Core Industries is given below:

Coal – Coal production (weight: 10.33 per cent) declined by 21.9 per cent in March, 2021 over March, 2020. Its cumulative index declined by 4.8 per cent during April to March, 2020-21 over corresponding period of the previous year.

Crude Oil – Crude Oil production (weight: 8.98 per cent) declined by 3.1 per cent in March, 2021 over March, 2020. Its cumulative index declined by 5.2 per cent during April to March, 2020-21 over the corresponding period of previous year.

Natural Gas – The Natural Gas production (weight: 6.88 per cent) increased by 12.3 per cent in March, 2021 over March, 2020. Its cumulative index declined by 8.2 per cent during April to March, 2020-21 over the corresponding period of previous year.

Petroleum Refinery Products – Petroleum Refinery production (weight: 28.04 per cent) declined by 0.7 per cent in March, 2021 over March, 2020. Its cumulative index declined by 11.2 per cent during April to March, 2020-21 over the corresponding period of previous year.

Fertilizers – Fertilizers production (weight: 2.63 per cent) declined by 5.0 per cent in March, 2021 over March, 2020. Its cumulative index increased by 1.8 per cent during April to March, 2020-21 over the corresponding period of previous year.

Steel – Steel production (weight: 17.92 per cent) increased by 23.0 per cent in March, 2021 over March, 2020. Its cumulative index declined by 9.5 per cent during April to March, 2020-21 over the corresponding period of previous year.

Cement – Cement production (weight: 5.37 per cent) increased by 32.5 per cent in March, 2021 over March, 2020. Its cumulative index declined by 11.9 per cent during April to March, 2020-21 over the corresponding period of previous year.

Electricity – Electricity generation (weight: 19.85 per cent) increased by 21.6 per cent in March, 2021 over March, 2020. Its cumulative index declined by 0.6 per cent during April to March, 2020-21 over the corresponding period of previous year.

Note 1: Data for January, 2021, February, 2021 and March, 2021 are provisional.

Note 2: Since April, 2014, Electricity generation data from Renewable sources are also included.

Note 3: The industry-wise weights indicated above are individual industry weight derived from IIP and blown up on pro rata basis to a combined weight of ICI equal to 100.

Note 4: Since March 2019, a new steel product called Hot Rolled Pickled and Oiled (HRPO) under the item ‘Cold Rolled (CR) coils’ within the production of finished steel has also been included.

Note 5: Release of the index for April, 2021 will be on Monday 31st May, 2021.

Annexure I

Performance of Eight Core Industries

Yearly Index & Growth Rate

Base Year: 2011-12=100

Index

Sector

Weight

2012-13

2013-14

2014-15

2015-16

2016-17

2017-18

2018-19

2019-20

2020-21* (April to March)

Coal

10.3335

103.2

104.2

112.6

118.0

121.8

124.9

134.1

133.6

127.3

Crude Oil

8.9833

99.4

99.2

98.4

97.0

94.5

93.7

89.8

84.5

80.1

Natural Gas

6.8768

85.6

74.5

70.5

67.2

66.5

68.4

69.0

65.1

59.8

Refinery Products

28.0376

107.2

108.6

108.8

114.1

119.7

125.2

129.1

129.4

114.9

Fertilizers

2.6276

96.7

98.1

99.4

106.4

106.6

106.6

107.0

109.8

111.8

Steel

17.9166

107.9

115.8

121.7

120.2

133.1

140.5

147.7

152.6

138.1

Cement

5.3720

107.5

111.5

118.1

123.5

122.0

129.7

147.0

145.7

128.3

Electricity

19.8530

104.0

110.3

126.6

133.8

141.6

149.2

156.9

158.4

157.5

Over all Index

100.00

103.8

106.5

111.7

115.1

120.5

125.7

131.2

131.6

122.5

*Provisional

Growth Rates (on Y-o-Y basis in per cent)

Sector

Weight

2012-13

2013-14

2014-15

2015-16

2016-17

2017-18

2018-19

2019-20

2020-21* (April to March)

Coal

10.3335

103.2

104.2

112.6

118.0

121.8

124.9

134.1

133.6

127.3

Crude Oil

8.9833

99.4

99.2

98.4

97.0

94.5

93.7

89.8

84.5

80.1

Natural Gas

6.8768

85.6

74.5

70.5

67.2

66.5

68.4

69.0

65.1

59.8

Refinery Products

28.0376

107.2

108.6

108.8

114.1

119.7

125.2

129.1

129.4

114.9

Fertilizers

2.6276

96.7

98.1

99.4

106.4

106.6

106.6

107.0

109.8

111.8

Steel

17.9166

107.9

115.8

121.7

120.2

133.1

140.5

147.7

152.6

138.1

Cement

5.3720

107.5

111.5

118.1

123.5

122.0

129.7

147.0

145.7

128.3

Electricity

19.8530

104.0

110.3

126.6

133.8

141.6

149.2

156.9

158.4

157.5

Overall Index

100.00

103.8

106.5

111.7

115.1

120.5

125.7

131.2

131.6

122.5

*Provisional

Annexure II

Performance of Eight Core Industries

Monthly Index & Growth Rate

Base Year: 2011-12=100

Index

Sector

Coal

Crude Oil

Natural Gas

Refinery Products

Fertilizers

Steel

Cement

Electricity

Overall Growth

Weight

10.3335

8.9833

6.8768

28.0376

2.6276

17.9166

5.3720

19.8530

100.00

Mar-20

4.0

-5.5

-15.1

-0.5

-11.9

-21.9

-25.1

-8.2

-8.6

Apr-20

-15.5

-6.4

-19.9

-24.2

-4.5

-82.8

-85.2

-22.9

-37.9

May-20

-14.0

-7.1

-16.8

-21.3

7.5

-40.4

-21.4

-14.8

-21.4

Jun-20

-15.5

-6.0

-12.0

-8.9

4.2

-23.2

-6.8

-10.0

-12.4

Jul-20

-5.7

-4.9

-10.2

-13.9

6.9

-6.5

-13.5

-2.4

-7.6

Aug-20

3.6

-6.3

-9.5

-19.1

7.3

0.5

-14.5

-1.8

-6.9

Sep-20

21.0

-6.0

-10.6

-9.5

-0.3

6.2

-3.4

4.8

0.6

Oct-20

11.7

-6.2

-8.6

-17.0

6.3

5.9

3.2

11.2

-0.5

Nov-20

3.3

-4.9

-9.3

-4.8

1.6

0.7

-7.3

3.5

-1.1

Dec-20

2.2

-3.6

-7.2

-2.8

-2.9

3.5

-7.2

5.1

0.4

Jan-21*

-1.9

-4.6

-2.0

-2.6

2.7

6.2

-5.8

5.5

0.9

Feb-21*

-4.4

-3.2

-1.0

-10.9

-3.7

1.3

-5.6

0.2

-3.8

Mar-21*

-21.9

-3.1

12.3

-0.7

-5.0

23.0

32.5

21.6

6.8

*Provisional

Growth Rates (on Y-o-Y basis in per cent)

Sector

Coal

Crude Oil

Natural Gas

Refinery Products

Fertilizers

Steel

Cement

Electricity

Overall Growth

Weight

10.3335

8.9833

6.8768

28.0376

2.6276

17.9166

5.3720

19.8530

100.00

Mar-20

4.0

-5.5

-15.1

-0.5

-11.9

-21.9

-25.1

-8.2

-8.6

Apr-20

-15.5

-6.4

-19.9

-24.2

-4.5

-82.8

-85.2

-22.9

-37.9

May-20

-14.0

-7.1

-16.8

-21.3

7.5

-40.4

-21.4

-14.8

-21.4

Jun-20

-15.5

-6.0

-12.0

-8.9

4.2

-23.2

-6.8

-10.0

-12.4

Jul-20

-5.7

-4.9

-10.2

-13.9

6.9

-6.5

-13.5

-2.4

-7.6

Aug-20

3.6

-6.3

-9.5

-19.1

7.3

0.5

-14.5

-1.8

-6.9

Sep-20

21.0

-6.0

-10.6

-9.5

-0.3

6.2

-3.4

4.8

0.6

Oct-20

11.7

-6.2

-8.6

-17.0

6.3

5.9

3.2

11.2

-0.5

Nov-20

3.3

-4.9

-9.3

-4.8

1.6

0.7

-7.3

3.5

-1.1

Dec-20

2.2

-3.6

-7.2

-2.8

-2.9

3.5

-7.2

5.1

0.4

Jan-21*

-1.9

-4.6

-2.0

-2.6

2.7

6.2

-5.8

5.5

0.9

Feb-21*

-4.4

-3.2

-1.0

-10.9

-3.7

1.3

-5.6

0.2

-3.8

Mar-21*

-21.9

-3.1

12.3

-0.7

-5.0

23.0

32.5

21.6

6.8

Source: PIB
नोट :- हमारे वेबसाइट www.indiangovtscheme.com पर ऐसी जानकारी रोजाना आती रहती है, तो आप ऐसी ही सरकारी योजनाओं की जानकारी पाने के लिए हमारे वेबसाइट www.indiangovtscheme.com से जुड़े रहे। 
*****

Index of Eight Core Industries (Base: 2011-12=100) for November, 2020

Index of Eight Core Industries (Base: 2011-12=100) for November, 2020

Ministry of Commerce & Industry

INDEX OF EIGHT CORE INDUSTRIES (BASE: 2011-12=100) FOR NOVEMBER, 2020

Posted On: 31 DEC 2020 5:00PM by PIB Delhi

The Office of Economic Adviser, Department for Promotion of Industry and Internal Trade is releasing Index of Eight Core Industries for the Month of November, 2020.

2. The combined Index of Eight Core Industries stood at 125.9 in November,2020, which declined by 2.6 (provisional) per cent as compared to the Index of November, 2019.Its cumulative growth during April to November, 2020-21 has been(-) 11.4%.

3.  Final growth rate of Index of Eight Core Industries for August’2020 is revised to(-) 6.9%.The Eight Core Industries comprise 40.27 per cent of the weight of items included in the Index of Industrial Production (IIP).Details of yearly/monthly index and growth rate is provided atAnnexure.

4.Monthly growth rates of Index of Eight Core Industries (Overall) is depicted in the graph: 
Index of Eight Core Industries

5. The summary of the Index of Eight Core Industries is given below:

Coal- Coal production (weight: 10.33per cent) increasedby 2.9 per cent in November, 2020 over November,2019. Its cumulative index declined by 2.6per cent during April toNovember, 2020-21over corresponding period of the previous year.

[post_ads]

Crude Oil-Crude Oil production (weight: 8.98per cent) declined by 4.9 per cent inNovember, 2020 over November,2019. Its cumulative index declined by 6.0 per cent during April toNovember, 2020-21over the corresponding period of previous year.

Natural Gas- The Natural Gas production (weight:6.88per cent) declinedby9.3 per cent in November, 2020 over November,2019. Its cumulative index declined by 12.1 per cent during April to November, 2020-21 over the corresponding period of previous year.

Refinery Products- Petroleum Refinery production (weight: 28.04per cent) declined by4.8 per cent in November, 2020 over November,2019. Its cumulative index declinedby 14.9per cent during April to November, 2020-21over the corresponding period of previous year.
Fertilizers-Fertilizers production (weight: 2.63 per cent) increased by 1.6 per cent in November,2020 overNovember,2019. Its cumulative index increasedby 3.8 per cent during April toNovember, 2020-21 over the corresponding period of previous year.

Steel-Steel production (weight: 17.92per cent) declinedby 4.4 per cent inNovember, 2020 over November,2019. Its cumulative index declined by 19.4per centduring April to November, 2020-21 over the corresponding period of previous year.

Cement-Cement production (weight:5.37per cent) declinedby7.1per cent inNovember, 2020overNovember,2019. Its cumulative index declinedby19.5per centduring April to November, 2020-21over the corresponding period of previous year.

Electricity- Electricity generation (weight:19.85per cent) increasedby2.2per centin November,2020over November,2019. Its cumulative indexdeclined by 4.7per cent duringApril to November, 2020-21over the corresponding period of previous year.

Note 1: Data for September, 2020, October, 2020and November, 2020are provisional.

Note 2: Since April, 2014, Electricity generation data from Renewable sources are also included.

Note 3: The industry-wise weights indicated above are individual industry weight derived from IIP and blown up on pro rata basis to a combined weight of ICI equal to 100.

Note 4: Since March 2019, a new steel product called Hot Rolled Pickled and Oiled (HRPO) under the item ‘Cold Rolled (CR) coils’ within the production of finished steel has also been included.

[post_ads_2]

Note5: Release of the index for December, 2020 will be on Friday 29th January,2021.

Annexure

Performance of Eight Core Industries

Yearly Index & Growth Rate

Base Year: 2011-12=100
Index

Sector

Weight

2012-13

2013-14

2014-15

2015-16

2016-17

2017-18

2018-19

2019-20

Apr- Nov 2019-20

Apr- Nov 2020-21

Coal

10.3335

103.2

104.2

112.6

118.0

121.8

124.9

134.1

133.6

113.1

110.2

Crude Oil

8.9833

99.4

99.2

98.4

97.0

94.5

93.7

89.8

84.5

85.6

80.4

Natural Gas

6.8768

85.6

74.5

70.5

67.2

66.5

68.4

69.0

65.1

66.5

58.4

Refinery Products

28.0376

107.2

108.6

108.8

114.1

119.7

125.2

129.1

129.4

128.0

108.9

Fertilizers

2.6276

96.7

98.1

99.4

106.4

106.6

106.6

107.0

109.8

109.4

113.5

Steel

17.9166

107.9

115.8

121.7

120.2

133.1

140.5

147.7

152.6

153.1

123.3

Cement

5.3720

107.5

111.5

118.1

123.5

122.0

129.7

147.0

145.7

141.8

114.2

Electricity

19.8530

104.0

110.3

126.6

133.8

141.6

149.2

156.9

158.4

161.7

154.1

Overall Index

100.0000

103.8

106.5

111.7

115.1

120.5

125.7

131.2

131.6

129.9

115.0


Growth Rates (in per cent)

Sector

Weight

2012-13

2013-14

2014-15

2015-16

2016-17

2017-18

2018-19

2019-20

Apr- Nov 2019-20

Apr- Nov 2020-21

Coal

10.3335

3.2

1.0

8.0

4.8

3.2

2.6

7.4

-0.4

-5.4

-2.6

Crude Oil

8.9833

-0.6

-0.2

-0.9

-1.4

-2.5

-0.9

-4.1

-5.9

-5.9

-6.0

Natural Gas

6.8768

-14.4

-12.9

-5.3

-4.7

-1.0

2.9

0.8

-5.6

-3.1

-12.1

Refinery Products

28.0376

7.2

1.4

0.2

4.9

4.9

4.6

3.1

0.2

-1.1

-14.9

Fertilizers

2.6276

-3.3

1.5

1.3

7.0

0.2

0.03

0.3

2.7

4.0

3.8

Steel

17.9166

7.9

7.3

5.1

-1.3

10.7

5.6

5.1

3.4

6.7

-19.4

Cement

5.3720

7.5

3.7

5.9

4.6

-1.2

6.3

13.3

-0.9

0.01

-19.5

Electricity

19.8530

4.0

6.1

14.8

5.7

5.8

5.3

5.2

0.9

0.8

-4.7

Overall Growth

100.0000

3.8

2.6

4.9

3.0

4.8

4.3

4.4

0.4

0.3

-11.4

Performance of Eight Core Industries

Monthly Index & Growth Rate

Base Year: 2011-12=100

Index

Sector

Coal

Crude Oil

Natural Gas

Refinery Products

Fertilizers

Steel

Cement

Electricity

Overall Index

Weight

10.3335

8.9833

6.8768

28.0376

2.6276

17.9166

5.3720

19.8530

100.0000

Nov-19

133.6

82.4

64.4

133.0

116.7

154.9

142.4

139.9

129.2

Dec-19

152.9

83.5

65.5

130.5

120.5

165.2

159.2

150.2

135.5

Jan-20

164.7

85.0

65.3

134.4

116.5

155.4

164.1

155.6

137.4

Feb-20

171.1

75.6

58.3

128.9

107.8

152.9

160.7

153.6

134.0

Mar-20

209.7

85.0

60.1

135.3

98.3

133.2

129.8

146.9

134.0

Apr-20

103.7

80.2

53.3

94.2

85.0

26.9

22.5

125.6

81.2

May-20

109.4

82.0

57.2

102.0

113.4

96.4

117.3

150.6

107.7

Jun-20

104.3

79.6

58.1

110.6

114.6

122.3

137.8

156.2

116.3

Jul-20

100.3

83.0

61.2

114.5

119.4

141.9

126.8

166.3

122.5

Aug-20

98.2

81.2

61.0

105.9

120.8

150.7

109.1

162.7

119.7

Sep-20

105.8

78.3

57.5

106.3

113.5

145.1

126.7

166.4

120.5

Oct-20

122.4

80.9

60.6

111.5

122.8

155.5

141.3

162.2

126.2

Nov-20

137.5

78.3

58.4

126.5

118.5

148.1

132.2

143.0

125.9

Growth Rates (in per cent)

Sector

Coal

Crude Oil

Natural Gas

Refinery Products

Fertilizers

Steel

Cement

Electricity

Overall Growth

Weight

10.3335

8.9833

6.8768

28.0376

2.6276

17.9166

5.3720

19.8530

100.0000

Nov-19

-3.5

-6.0

-6.4

3.1

13.6

7.0

4.3

-4.9

0.7

Dec-19

6.1

-7.4

-9.2

3.0

10.2

8.7

5.5

0.0

3.1

Jan-20

8.0

-5.3

-9.0

1.9

-0.1

1.6

5.1

3.2

2.2

Feb-20

11.3

-6.4

-9.6

7.4

2.9

2.9

7.8

11.5

6.4

Mar-20

4.0

-5.5

-15.1

-0.5

-11.9

-21.9

-25.1

-8.2

-8.6

Apr-20

-15.5

-6.4

-19.9

-24.2

-4.5

-82.8

-85.2

-22.9

-37.9

May-20

-14.0

-7.1

-16.8

-21.3

7.5

-40.4

-21.4

-14.8

-21.4

Jun-20

-15.5

-6.0

-12.0

-8.9

4.2

-23.2

-6.8

-10.0

-12.4

Jul-20

-5.7

-4.9

-10.2

-13.9

6.9

-6.5

-13.5

-2.4

-7.6

Aug-20

3.6

-6.3

-9.5

-19.1

7.3

0.5

-14.5

-1.8

-6.9

Sep-20

21.2

-6.0

-10.6

-9.5

-0.3

2.8

-3.5

4.8

-0.1

Oct-20

11.7

-6.2

-8.6

-17.0

6.3

4.0

3.2

11.2

-0.9

Nov-20

2.9

-4.9

-9.3

-4.8

1.6

-4.4

-7.1

2.2

-2.6

Source : PIB

नोट :- हमारे वेबसाइट www.indiangovtscheme.com पर ऐसी जानकारी रोजाना आती रहती है, तो आप ऐसी ही सरकारी योजनाओं की जानकारी पाने के लिए हमारे वेबसाइट www.indiangovtscheme.com से जुड़े रहे। 
*****

Index of Eight Core Industries (Base 2011-12=100) for September, 2020

 Ministry of Commerce & Industry

Index of Eight Core Industries (Base: 2011-12=100) for September, 2020

Posted On: 29 OCT 2020 5:00PM by PIB Delhi

The Office of Economic Adviser, Department for Promotion of Industry and Internal Trade is releasing Index of Eight Core Industries for the Month of September, 2020.

2. The combined Index of Eight Core Industries stood at 119.7 in September,2020, which declined by 0.8 (provisional) per cent as compared to the Index of September, 2019.Its cumulative growth during April to September, 2020-21 has been(-) 14.9%.

3.  Final growth rate of Index of Eight Core Industries for June’2020 is revised to(-) 12.4 %.The Eight Core Industries comprise 40.27 per cent of the weight of items included in the Index of Industrial Production (IIP).Details of yearly/monthly index and growth rate is provided atAnnexure.

4.Monthly growth rates of Index of Eight Core Industries (Overall) is depicted in the graph: 

Index of Eight Core Industries

5. The summary of the Index of Eight Core Industries is given below:

Coal- Coal production (weight: 10.33per cent) increasedby 21.2 per cent in September, 2020 over September,2019. Its cumulative index declined by 6.1per cent during April toSeptember, 2020-21over corresponding period of the previous year.

[post_ads]

Crude Oil-Crude Oil production (weight: 8.98per cent) declined by 6.0 per cent inSeptember, 2020 over September,2019. Its cumulative index declined by 6.1 per cent during April toSeptember, 2020-21over the corresponding period of previous year.

Natural Gas- The Natural Gas production (weight:6.88per cent) declinedby10.6 per cent in September, 2020 over September,2019. Its cumulative index declined by 13.2 per cent during April to September, 2020-21 over the corresponding period of previous year.

Refinery Products- Petroleum Refinery production (weight: 28.04per cent) declined by9.5 per cent in September, 2020 over September,2019. Its cumulative index declinedby 16.3per cent during April to September, 2020-21over the corresponding period of previous year.

Fertilizers-Fertilizers production (weight: 2.63 per cent) declined by 0.3 per cent in September,2020 overSeptember,2019. Its cumulative index increasedby 3.7 per cent during April toSeptember, 2020-21 over the corresponding period of previous year.

Steel-Steel production (weight: 17.92per cent)increasedby 0.9 per cent inSeptember, 2020 over September,2019. Its cumulative index declined by 26.7per centduring April to September, 2020-21 over the corresponding period of previous year.

Cement-Cement production (weight:5.37per cent) declinedby3.5per cent in September, 2020 over September,2019. Its cumulative index declinedby25.1per centduring April to September, 2020-21over the corresponding period of previous year.

Electricity- Electricity generation (weight:19.85per cent) increasedby3.7per cent in September, 2020 over September,2019. Its cumulative index declined by 8.2per cent during April to September, 2020-21over the corresponding period of previous year.

Note 1: Data for July, 2020, August, 2020and September, 2020are provisional.
Note 2: Since April, 2014, Electricity generation data from Renewable sources are also included.
Note 3: The industry-wise weights indicated above are individual industry weight derived from IIP and blown up on pro rata basis to a combined weight of ICI equal to 100.
Note 4: Since March 2019, a new steel product called Hot Rolled Pickled and Oiled (HRPO) under the item ‘Cold Rolled (CR) coils’ within the production of finished steel has also been included.
Note5: Release of the index for October, 2020 will be on Friday 27thNovember,2020.

Annexure

Performance of Eight Core Industries

Yearly Index & Growth Rate

Base Year: 2011-12=100

Index

Sector

Weight

2012-13

2013-14

2014-15

2015-16

2016-17

2017-18

2018-19

2019-20

Apr-Sep 2019-20

Apr-Sep 2020-21

Coal

10.3335

103.2

104.2

112.6

118.0

121.8

124.9

134.1

133.6

110.3

103.6

Crude Oil

8.9833

99.4

99.2

98.4

97.0

94.5

93.7

89.8

84.5

86.0

80.7

Natural Gas

6.8768

85.6

74.5

70.5

67.2

66.5

68.4

69.0

65.1

66.9

58.1

Refinery Products

28.0376

107.2

108.6

108.8

114.1

119.7

125.2

129.1

129.4

126.1

105.6

Fertilizers

2.6276

96.7

98.1

99.4

106.4

106.6

106.6

107.0

109.8

107.1

111.1

Steel

17.9166

107.9

115.8

121.7

120.2

133.1

140.5

147.7

152.6

153.4

112.4

Cement

5.3720

107.5

111.5

118.1

123.5

122.0

129.7

147.0

145.7

142.5

106.7

Electricity

19.8530

104.0

110.3

126.6

133.8

141.6

149.2

156.9

158.4

168.0

154.3

Overall Index

100.0000

103.8

106.5

111.7

115.1

120.5

125.7

131.2

131.6

130.4

111.0


Growth Rates (in per cent)

Sector

Weight

2012-13

2013-14

2014-15

2015-16

2016-17

2017-18

2018-19

2019-20

Apr-Sep 2019-20

Apr-Sep 2020-21

Coal

10.3335

3.2

1.0

8.0

4.8

3.2

2.6

7.4

-0.4

-3.5

-6.1

Crude Oil

8.9833

-0.6

-0.2

-0.9

-1.4

-2.5

-0.9

-4.1

-5.9

-6.0

-6.1

Natural Gas

6.8768

-14.4

-12.9

-5.3

-4.7

-1.0

2.9

0.8

-5.6

-2.0

-13.2

Refinery Products

28.0376

7.2

1.4

0.2

4.9

4.9

4.6

3.1

0.2

-2.0

-16.3

Fertilizers

2.6276

-3.3

1.5

1.3

7.0

0.2

0.03

0.3

2.7

1.1

3.7

Steel

17.9166

7.9

7.3

5.1

-1.3

10.7

5.6

5.1

3.4

7.9

-26.7

Cement

5.3720

7.5

3.7

5.9

4.6

-1.2

6.3

13.3

-0.9

0.7

-25.1

Electricity

19.8530

4.0

6.1

14.8

5.7

5.8

5.3

5.2

0.9

3.9

-8.2

Overall Growth

100.0000

3.8

2.6

4.9

3.0

4.8

4.3

4.4

0.4

1.3

-14.9

Performance of Eight Core Industries

[post_ads_2]

Monthly Index & Growth Rate

Base Year: 2011-12=100

Index

Sector

Coal

Crude Oil

Natural Gas

Refinery Products

Fertilizers

Steel

Cement

Electricity

Overall Index

Weight

10.3335

8.9833

6.8768

28.0376

2.6276

17.9166

5.3720

19.8530

100.0000

Sep-19

87.3

83.4

64.3

117.5

113.9

141.2

131.3

158.7

120.7

Oct-19

109.6

86.3

66.3

134.2

115.5

149.5

137.0

145.8

127.4

Nov-19

133.6

82.4

64.4

133.0

116.7

154.9

142.4

139.9

129.2

Dec-19

152.9

83.5

65.5

130.5

120.5

165.2

159.2

150.2

135.5

Jan-20

164.7

85.0

65.3

134.4

116.5

155.4

164.1

155.6

137.4

Feb-20

171.1

75.6

58.3

128.9

107.8

152.9

160.7

153.6

134.0

Mar-20

209.7

85.0

60.1

135.3

98.3

133.2

129.8

146.9

134.0

Apr-20

103.7

80.2

53.3

94.2

85.0

26.9

22.5

125.6

81.2

May-20

109.4

82.0

57.2

102.0

113.4

96.4

117.3

150.6

107.7

Jun-20

104.3

79.6

58.1

110.6

114.6

122.3

137.8

156.2

116.3

Jul-20

100.3

83.0

61.2

114.5

119.4

139.2

126.8

166.3

122.0

Aug-20

98.3

81.2

61.0

105.9

120.8

147.4

109.1

162.7

119.1

Sep-20

105.8

78.3

57.5

106.3

113.5

142.5

126.7

164.6

119.7

Growth Rates (in per cent)

Sector

Coal

Crude Oil

Natural Gas

Refinery Products

Fertilizers

Steel

Cement

Electricity

Overall Growth

Weight

10.3335

8.9833

6.8768

28.0376

2.6276

17.9166

5.3720

19.8530

100.0000

Sep-19

-20.5

-5.4

-4.9

-6.6

5.4

-1.4

-2.0

-2.6

-5.1

Oct-19

-17.6

-5.1

-5.6

0.4

11.8

-0.5

-7.7

-12.2

-5.5

Nov-19

-3.5

-6.0

-6.4

3.1

13.6

7.0

4.3

-4.9

0.7

Dec-19

6.1

-7.4

-9.2

3.0

10.2

8.7

5.5

0.0

3.1

Jan-20

8.0

-5.3

-9.0

1.9

-0.1

1.6

5.1

3.2

2.2

Feb-20

11.3

-6.4

-9.6

7.4

2.9

2.9

7.8

11.5

6.4

Mar-20

4.0

-5.5

-15.1

-0.5

-11.9

-21.9

-25.1

-8.2

-8.6

Apr-20

-15.5

-6.4

-19.9

-24.2

-4.5

-82.8

-85.2

-22.9

-37.9

May-20

-14.0

-7.1

-16.8

-21.3

7.5

-40.4

-21.4

-14.8

-21.4

Jun-20

-15.5

-6.0

-12.0

-8.9

4.2

-23.2

-6.8

-10.0

-12.4

Jul-20

-5.7

-4.9

-10.2

-13.9

6.9

-8.3

-13.5

-2.5

-8.0

Aug-20

3.6

-6.3

-9.5

-19.1

7.3

-1.7

-14.5

-1.8

-7.3

Sep-20

21.2

-6.0

-10.6

-9.5

-0.3

0.9

-3.5

3.7

-0.8

Source : PIB
नोट :- हमारे वेबसाइट www.indiangovtscheme.com पर ऐसी जानकारी रोजाना आती रहती है, तो आप ऐसी ही सरकारी योजनाओं की जानकारी पाने के लिए हमारे वेबसाइट www.indiangovtscheme.com से जुड़े रहे। 
*****

Index of Eight Core Industries (Base: 2011-12=100) March, 2019

Index of Eight Core Industries (Base: 2011-12=100) March, 2019 


Press Information Bureau 

Government of India
Ministry of Commerce & Industry
30-April-2019 16:58 IST

Index of Eight Core Industries (Base: 2011-12=100) March, 2019 
1. The summary of the Index of Eight Core Industries (base: 2011-12) is given at the Annexure.

core-industries-index

2. The Eight Core Industries comprise 40.27 per cent of the weight of items included in the Index of Industrial Production (IIP). The combined Index of Eight Core Industries stood at 145.0 in March, 2019, which was 4.7 per cent higher as compared to the index of March, 2018. Its cumulative growth during April to March, 2018-19 was 4.3 percent.
Coal
3. Coal production (weight: 10.33per cent) increased by 9.1 per cent in March, 2019 over March, 2018. Its cumulative index increased by 7.3 percent during April to March, 2018-19over corresponding period of the previous year.
[post_ads]


Crude Oil

4. Crude Oil production (weight: 8.98per cent) declined by 6.2 per cent in March, 2019 over March, 2018. Its cumulative index declined by 4.1 percent during April to March, 2018-19 over the corresponding period of previous year.
Natural Gas
5. The Natural Gas production (weight: 6.88per cent) increased by 1.4 per cent in March, 2019 over March, 2018. Its cumulative index increased by 0.8 percent during April to March, 2018-19 over the corresponding period of previous year.
natural+gas

Refinery Products
6. Petroleum Refinery production (weight: 28.04 percent) increased by 4.3 percent in March, 2019 over March, 2018. Its cumulative index increased by 3.1 percent during April to March, 2018-19 over the corresponding period of previous year.
Fertilizers
7. Fertilizers production (weight: 2.63 per cent) increased by 4.3 percent in March, 2019 over March, 2018. Its cumulative index increased by 0.3 per cent during April to March, 2018-19 over the corresponding period of previous year.
Steel
8. Steel production (weight: 17.92 percent)increased by 6.7 per cent in March, 2019 over March, 2018. Its cumulative index increased by 4.7 percent during April to March, 2018-19 over the corresponding period of previous year.
Cement
9. Cement production (weight: 5.37 percent) increased by 15.7 per cent in March, 2019 over March, 2018. Its cumulative index increased by 13.3 percent during April to March, 2018-19 over the corresponding period of previous year.
Electricity
10. Electricity generation (weight: 19.85 percent) increased by 1.4 percent in March, 2019 over March, 2018. Its cumulative index increased by5.1 percent during April to March, 2018-19over the corresponding period of previous year.
Note 
  • 1: Data for January, 2019, February, 2019 and March, 2019 are provisional.
  • 2: Since April, 2014, Electricity generation data from Renewable sources are also included.
  • 3: The industry-wise weights indicated above are individual industry weight derived from IIP and blown up on pro rata basis to a combined weight of ICI equal to 100.
  • 4: Release of the index for April, 2019 will be on Friday,31stMay, 2019.
[post_ads_2]
Annexure
Performance of Eight Core Industries
Yearly Index & Growth Rate
Base Year: 2011-12=100

Index
Sector Weight 2012-13 2013-14 2014-15 2015-16 2016-17 Apr-Mar 2017-18 Apr-Mar 2018-19
Coal 10.3335 103.2 104.2 112.6 118.0 121.8 124.9 134.1
Crude Oil 8.9833 99.4 99.2 98.4 97.0 94.5 93.7 89.8
Natural Gas 6.8768 85.6 74.5 70.5 67.2 66.5 68.4 69.0
Refinery Products 28.0376 107.2 108.6 108.8 114.1 119.7 125.2 129.1
Fertilizers 2.6276 96.7 98.1 99.4 106.4 106.6 106.6 107.0
Steel 17.9166 107.9 115.8 121.7 120.2 133.1 140.5 147.1
Cement 5.3720 107.5 111.5 118.1 123.5 122.0 129.7 147.0
Electricity 19.8530 104.0 110.3 126.6 133.8 141.6 149.2 156.8
Overall Index 100.0000 103.8 106.5 111.7 115.1 120.5 125.7 131.0
Growth Rates(in per cent)

Sector Weight 2012-13 2013-14 2014-15 2015-16 2016-17 Apr-Mar 2017-18 Apr-Mar 2018-19
Coal 10.3335 3.2 1.0 8.0 4.8 3.2 2.6 7.3
Crude Oil 8.9833 -0.6 -0.2 -0.9 -1.4 -2.5 -0.9 -4.1
Natural Gas 6.8768 -14.4 -12.9 -5.3 -4.7 -1.0 2.9 0.8
Refinery Products 28.0376 7.2 1.4 0.2 4.9 4.9 4.6 3.1
Fertilizers 2.6276 -3.3 1.5 1.3 7.0 0.2 0.03 0.3
Steel 17.9166 7.9 7.3 5.1 -1.3 10.7 5.6 4.7
Cement 5.3720 7.5 3.7 5.9 4.6 -1.2 6.3 13.3
Electricity 19.8530 4.0 6.1 14.8 5.7 5.8 5.3 5.1
Overall Index 100.0000 3.8 2.6 4.9 3.0 4.8 4.3 4.3

Performance of Eight Core Industries
Monthly Index & Growth Rate
Base Year: 2011-12=100


Index

Sector Coal Crude Oil Natural Gas Refinery Products Fertilizers Steel Cement Electricity Overall Index
Weight 10.3335 8.9833 6.8768 28.0376 2.6276 17.9166 5.3720 19.8530 100.0000
Mar-18 184.9 95.8 69.8 130.3 107.0 153.2 149.6 156.7 138.5
Apr-18 118.8 91.8 67.1 119.1 93.1 138.1 149.1 153.7 124.3
May-18 125.2 94.8 68.7 131.6 106.6 142.8 145.3 164.7 131.9
Jun-18 120.0 90.9 67.4 133.8 108.3 143.8 150.7 159.9 131.2
Jul-18 108.1 91.2 68.5 134.1 110.0 140.3 136.0 162.1 129.2
Aug-18 103.8 91.6 70.2 127.7 109.4 144.5 134.5 167.2 128.8
Sep-18 109.8 88.1 67.6 125.8 108.0 143.2 133.9 162.9 127.2
Oct-18 132.9 90.9 70.3 133.8 103.3 150.2 148.4 166.0 134.8
Nov-18 138.4 87.6 68.9 128.9 102.7 144.8 136.5 147.2 128.3
Dec-18 144.1 90.2 72.2 126.6 109.4 152.0 151.0 150.3 131.5
Jan-19 152.1 89.7 71.8 131.9 116.6 153.0 156.1 150.7 134.5
Feb-19 153.8 80.8 64.4 120.0 104.8 148.6 149.1 137.7 125.9
Mar-19 201.7 89.9 70.7 135.9 111.5 163.4 173.2 159.0 145.0
Growth Rates (in per cent)

Sector Coal Crude Oil Natural Gas Refinery Products Fertilizers Steel Cement Electricity Overall Index
Weight 10.3335 8.9833 6.8768 28.0376 2.6276 17.9166 5.3720 19.8530 100.0000
Mar-18 9.1 -1.6 1.0 1.1 3.2 4.7 13.5 6.0 4.5
Apr-18 15.2 -0.8 5.7 2.7 4.6 3.0 21.9 2.1 4.7
May-18 12.0 -2.9 -1.4 4.9 8.4 -0.1 13.0 4.1 4.1
Jun-18 11.5 -3.4 -2.7 12.1 1.0 4.2 14.2 8.4 7.8
Jul-18 9.8 -5.4 -5.2 12.3 1.3 6.9 11.2 6.7 7.3
Aug-18 2.4 -3.7 1.0 5.1 -5.3 4.0 14.6 7.6 4.7
Sep-18 6.4 -4.2 -1.7 2.5 2.5 3.2 11.8 8.2 4.3
Oct-18 11.3 -5.0 -0.9 1.3 -11.5 2.4 18.4 10.9 4.8
Nov-18 3.7 -3.5 0.5 2.3 -8.1 5.3 8.8 5.1 3.3
Dec-18 1.1 -4.3 4.2 -4.8 -2.4 10.1 11.6 4.4 2.1
Jan-19 1.7 -4.3 6.2 -2.6 10.5 5.5 11.0 0.8 1.5
Feb-19 7.4 -6.1 3.8 -0.8 2.5 4.9 8.0 1.2 2.2
Mar-19 9.1 -6.2 1.4 4.3 4.3 6.7 15.7 1.4 4.7

Index of Eight Core Industries (Base: 2011-12=100) May, 2019
Index of Eight Core Industries (Base: 2011-12=100) February, 2019 

*****

Index of Eight Core Industries (Base: 2011-12=100) Month of November, 2019

Index of Eight Core Industries (Base: 2011-12=100) Month of November, 2019

The summary of the Index of Eight Core Industries (base: 2011-12) is given at the Annexure.
The Eight Core Industries comprise 40.27 per cent of the weight of items included in the Index of Industrial Production (IIP). The combined Index of Eight Core Industries stood at 126.3 in November, 2019, which declined by 1.5 per centas compared to the index of November,2018. Its cumulative growth during April to November,2019-20 was 0.0 per cent.
Index+of+Eight+Core+Industries
Coal
Coal production (weight: 10.33 per cent) declined by 2.5 per cent in November,2019 over November,2018. Its cumulative index declined by 5.3 per cent during April to November,2019-20 over corresponding period of the previous year.
Crude Oil
Crude Oil production (weight: 8.98 per cent) declined by 6.0 per cent in November,2019 over November,2018. Its cumulative index declined by 5.9 per cent during April to November,2019-20 over the corresponding period of previous year.
Natural Gas
The Natural Gas production (weight: 6.88 per cent) declined by 6.4 per cent in November,2019 over November,2018. Its cumulative index declined by 3.1 per cent during April to November,2019-20 over the corresponding period of previous year.
Refinery Products
Petroleum Refinery production (weight: 28.04 per cent)increased by 3.1 per cent in November,2019 over November,2018. Its cumulative index declined by 1.1 per cent during April to November,2019-20 over the corresponding period of previous year.
Fertilizers
Fertilizers production (weight: 2.63 per cent) increased by 13.6 per cent in November,2019 over November,2018. Its cumulative index increased by 4.0 per cent during April to November,2019-20 over the corresponding period of previous year.
Steel
Steel production (weight: 17.92 per cent)declined by 3.7 per cent in November,2019 over November,2018. Its cumulative index increased by 5.2 per cent during April to November,2019-20 over the corresponding period of previous year.
Cement
Cement production (weight: 5.37 per cent) increased by 4.1 per cent in November, 2019 over November,2018. Its cumulative index declined by 0.02 per cent during April to November,2019-20 over the corresponding period of previous year.
Electricity
Electricity generation (weight: 19.85 per cent) declined by 5.7 per cent in November, 2019 over November,2018. Its cumulative index increased by 0.7 per cent during April to November,2019-20 over the corresponding period of previous year.
  • Note 1: Data for September, 2019, October, 2019 and November, 2019 are provisional.
  • Note 2: Since April, 2014, Electricity generation data from Renewable sources are also included.
  • Note 3: The industry-wise weights indicated above are individual industry weight derived from IIP and blown up on pro rata basis to a combined weight of ICI equal to 100.
  • Note 4: Since March 2019, a new steel product called Hot Rolled Pickled and Oiled (HRPO) under the item ‘Cold Rolled (CR) coils’ within the production of finished steel has also been included.
  • Note 5: Release of the index for December, 2019 will be on Friday, 31st January, 2020.

Annexure
                                                   Performance of Eight Core Industries
Yearly Index & Growth Rate
Base Year: 2011-12=100
Index
Sector
Weight
2013-14
2014-15
2015-16
2016-17
2017-18
2018-19
Apr-Nov 2018-19
Apr-Nov 2019-20
Coal
10.3335
104.2
112.6
118.0
121.8
124.9
134.1
119.6
113.3
Crude Oil
8.9833
99.2
98.4
97.0
94.5
93.7
89.8
90.9
85.6
Natural Gas
6.8768
74.5
70.5
67.2
66.5
68.4
69.0
68.6
66.5
Refinery Products
28.0376
108.6
108.8
114.1
119.7
125.2
129.1
129.4
128.0
Fertilizers
2.6276
98.1
99.4
106.4
106.6
106.6
107.0
105.2
109.4
Steel
17.9166
115.8
121.7
120.2
133.1
140.5
147.7
143.5
150.9
Cement
5.3720
111.5
118.1
123.5
122.0
129.7
147.0
141.8
141.8
Electricity
19.8530
110.3
126.6
133.8
141.6
149.2
156.9
160.5
161.6
Overall Index
100.0000
106.5
111.7
115.1
120.5
125.7
131.2
129.5
129.4
Growth Rates(in per cent)
Sector
Weight
2013-

14

2014-

15

2015-

16

2016-

17

2017-

18

2018-

19

Apr-Nov 2018-19
Apr-Nov 2019-20
Coal
10.3335
1.0
8.0
4.8
3.2
2.6
7.4
9.0
-5.3
Crude Oil
8.9833
-0.2
-0.9
-1.4
-2.5
-0.9
-4.1
-3.6
-5.9
Natural Gas
6.8768
-12.9
-5.3
-4.7
-1.0
2.9
0.8
-0.7
-3.1
Refinery Products
28.0376
1.4
0.2
4.9
4.9
4.6
3.1
5.3
-1.1
Fertilizers
2.6276
1.5
1.3
7.0
0.2
0.03
0.3
-1.3
4.0
Steel
17.9166
7.3
5.1
-1.3
10.7
5.6
5.1
3.6
5.2
Cement
5.3720
3.7
5.9
4.6
-1.2
6.3
13.3
14.2
-0.02
Electricity
19.8530
6.1
14.8
5.7
5.8
5.3
5.2
6.6
0.7
Overall Growth
100.0000
2.6
4.9
3.0
4.8
4.3
4.4
5.1
0.0
Performance of Eight Core Industries
Monthly Index & Growth Rate
Base Year: 2011-12=100

Index
Sector Coal Crude Oil Natural Gas Refinery Products Fertilizers Steel Cement Electricity Overall Index
Weight
10.3335
8.9833
6.8768
28.0376
2.6276
17.9166
5.3720
19.8530
100.0000
Nov-18
138.4
87.6
68.9
128.9
102.7
144.8
136.5
147.2
128.3
Dec-18
144.1
90.2
72.2
126.6
109.4
152.0
151.0
150.3
131.5
Jan-19
152.5
89.7
71.8
131.9
116.6
153.0
156.1
150.7
134.5
Feb-19
153.8
80.8
64.4
120.0
104.8
148.6
149.1
137.7
125.9
Mar-19
201.7
89.9
70.7
135.9
111.5
170.7
173.2
160.1
146.5
Apr-19
122.6
85.6
66.6
124.3
89.0
156.4
152.5
162.8
130.7
May-19
127.3
88.2
68.7
129.6
105.5
161.8
149.3
176.8
137.0
Jun-19
123.5
84.7
66.0
121.4
110.0
159.3
147.9
173.6
132.8
Jul-19
106.4
87.2
68.1
132.9
111.7
151.7
146.5
170.5
132.6
Aug-19
94.8
86.6
67.4
131.0
112.6
150.0
127.7
165.7
128.5
Sep-19
87.3
83.4
64.3
117.5
113.9
141.1
131.3
158.7
120.7
Oct-19
109.6
86.3
66.3
134.2
115.5
147.4
137.0
145.8
127.0
Nov-19
134.9
82.4
64.4
133.0
116.7
139.4
142.0
138.8
126.3

Growth Rates (in per cent)
Sector Coal Crude Oil Natural Gas Refinery Products Fertilizers Steel Cement Electricity Overall Growth
Weight
10.3335
8.9833
6.8768
28.0376
2.6276
17.9166
5.3720
19.8530
100.0000
Nov-18
3.7
-3.5
0.5
2.3
-8.1
5.3
8.8
5.1
3.3
Dec-18
1.1
-4.3
4.2
-4.8
-2.4
10.1
11.6
4.4
2.1
Jan-19
2.0
-4.3
6.2
-2.6
10.5
5.5
11.0
0.8
1.5
Feb-19
7.4
-6.1
3.8
-0.8
2.5
4.9
8.0
1.2
2.2
Mar-19
9.1
-6.2
1.4
4.3
4.3
11.5
15.7
2.1
5.8
Apr-19
3.2
-6.7
-0.8
4.3
-4.4
13.3
2.3
5.9
5.2
May-19
1.7
-6.9
-0.1
-1.5
-1.0
13.3
2.8
7.4
3.8
Jun-19
2.9
-6.8
-2.1
-9.3
1.5
10.8
-1.9
8.6
1.2
Jul-19
-1.6
-4.4
-0.5
-0.9
1.5
8.1
7.7
5.2
2.6
Aug-19
-8.6
-5.4
-3.9
2.6
2.9
3.8
-5.1
-0.9
-0.2
Sep-19
-20.5
-5.4
-4.9
-6.6
5.4
-1.5
-2.0
-2.6
-5.1
Oct-19
-17.6
-5.1
-5.7
0.4
11.8
-1.9
-7.7
-12.2
-5.8
Nov-19
-2.5
-6.0
-6.4
3.1
13.6
-3.7
4.1
-5.7
-1.5
Source PIB
*****

Index of Eight Core Industries (Base: 2011-12=100) August, 2019

Press Information Bureau
Government of India
Ministry of Commerce & Industry
30-September-2019 16:58 IST

Index of Eight Core Industries (Base: 2011-12=100) August, 2019
The summary of the Index of Eight Core Industries (base: 2011-12) is given at the Annexure.
The Eight Core Industries comprise 40.27 per cent of the weight of items included in the Index of Industrial Production (IIP). The combined Index of Eight Core Industries stood at 128.2 in August, 2019, which declined by 0.5 per cent as compared to the index of August, 2018. Its cumulative growth during April to August, 2019-20 was 2.4 per cent.
Index+of+Eight+Core+Industries

Coal

Coal production (weight: 10.33 per cent) declined by 8.6 per cent in August, 2019 over August, 2018. Its cumulative index declined by 0.2 per cent during April to August, 2019-20 over corresponding period of the previous year.
Crude Oil
Crude Oil production (weight: 8.98 per cent) declined by 5.4 per cent in August, 2019 over August, 2018. Its cumulative index declined by 6.1 per cent during April to August, 2019-20 over the corresponding period of previous year.
Natural Gas
The Natural Gas production (weight: 6.88 per cent) declined by 3.9 per cent in August, 2019 over August, 2018. Its cumulative index declined by 1.5 per cent during April to August, 2019-20 over the corresponding period of previous year.

यह भी पड़े Index of Eight Core Industries (Base: 2011-12=) July, 2018

Refinery Products

Petroleum Refinery production (weight: 28.04 per cent) increased by 2.6 per cent in August, 2019 over August, 2018. Its cumulative index declined by 1.1 per cent during April to August, 2019-20 over the corresponding period of previous year.
Fertilizers
Fertilizers production (weight: 2.63 per cent) increased by 2.9 per cent in August, 2019 over August, 2018. Its cumulative index increased by 0.3 per cent during April to August, 2019-20 over the corresponding period of previous year.
Steel
Steel production (weight: 17.92 per cent) increased by 5.0 per cent in August, 2019 over August, 2018. Its cumulative index increased by 9.7 per cent during April to August, 2019-20 over the corresponding period of previous year.
Cement
Cement production (weight: 5.37 per cent) declined by 4.9 per cent in August, 2019 over August, 2018. Its cumulative index increased by 1.3 per cent during April to August, 2019-20 over the corresponding period of previous year.
Electricity
Electricity generation (weight: 19.85 per cent) declined by 2.9 per cent in August, 2019 over August, 2018. Its cumulative index increased by 4.6 per cent during April to August, 2019-20 over the corresponding period of previous year.
Note 1: Data for June, 2019, July, 2019 and August, 2019 are provisional.
Note 2: Since April, 2014, Electricity generation data from Renewable sources are also included.
Note 3: The industry-wise weights indicated above are individual industry weight derived from IIP and blown up on pro rata basis to a combined weight of ICI equal to 100.
Note 4: Since March 2019, a new steel product called Hot Rolled Pickled and Oiled (HRPO) under the item ‘Cold Rolled (CR) coils’ within the production of finished steel has also been included.
Note 5: Release of the index for September, 2019 will be on Thursday, 31st October, 2019.
Annexure
Performance of Eight Core Industries
Yearly Index & Growth Rate
Base Year: 2011-12=100
Index
Sector
Weight
2013-14
2014-15
2015-16
2016-17
2017-18
2018-19
Apr-Aug 2018-19
Apr-Aug 2019-20
Coal
10.3335
104.2
112.6
118.0
121.8
124.9
134.1
115.2
115.0
Crude Oil
8.9833
99.2
98.4
97.0
94.5
93.7
89.8
92.1
86.5
Natural Gas
6.8768
74.5
70.5
67.2
66.5
68.4
69.0
68.4
67.4
Refinery Products
28.0376
108.6
108.8
114.1
119.7
125.2
129.1
129.3
127.8
Fertilizers
2.6276
98.1
99.4
106.4
106.6
106.6
107.0
105.5
105.7
Steel
17.9166
115.8
121.7
120.2
133.1
140.5
147.7
141.9
155.7
Cement
5.3720
111.5
118.1
123.5
122.0
129.7
147.0
143.1
144.9
Electricity
19.8530
110.3
126.6
133.8
141.6
149.2
156.9
161.5
168.9
Overall Index
100.0000
106.5
111.7
115.1
120.5
125.7
131.2
129.1
132.1
Performance of Eight Core Industries
Monthly Index & Growth Rate
Base Year: 2011-12=100
Index
Growth Rates (in per cent)
Sector
Weight
2013-14
2014-15
2015-16
2016-17
2017-18
2018-19
Apr-Aug 2018-19
Apr-Aug 2019-20
Coal
10.3335
1.0
8.0
4.8
3.2
2.6
7.4
10.3
-0.2
Crude Oil
8.9833
-0.2
-0.9
-1.4
-2.5
-0.9
-4.1
-3.3
-6.1
Natural Gas
6.8768
-12.9
-5.3
-4.7
-1.0
2.9
0.8
-0.7
-1.5
Refinery Products
28.0376
1.4
0.2
4.9
4.9
4.6
3.1
7.4
-1.1
Fertilizers
2.6276
1.5
1.3
7.0
0.2
0.03
0.3
1.7
0.3
Steel
17.9166
7.3
5.1
-1.3
10.7
5.6
5.1
3.5
9.7
Cement
5.3720
3.7
5.9
4.6
-1.2
6.3
13.3
15.0
1.3
Electricity
19.8530
6.1
14.8
5.7
5.8
5.3
5.2
5.8
4.6
Overall Index
100.0000
2.6
4.9
3.0
4.8
4.3
4.4
5.7
2.4
Sector
Coal
Crude Oil
Natural Gas
Refinery Products
Fertilizers
Steel
Cement
Electricity
Overall Index
Weight
10.3335
8.9833
6.8768
28.0376
2.6276
17.9166
5.3720
19.8530
100.0000
Aug-18
103.8
91.6
70.2
127.7
109.4
144.5
134.5
167.2
128.8
Sep-18
109.8
88.1
67.6
125.8
108.0
143.2
133.9
162.9
127.2
Oct-18
132.9
90.9
70.3
133.8
103.3
150.2
148.4
166.0
134.8
Nov-18
138.4
87.6
68.9
128.9
102.7
144.8
136.5
147.2
128.3
Dec-18
144.1
90.2
72.2
126.6
109.4
152.0
151.0
150.3
131.5
Jan-19
152.5
89.7
71.8
131.9
116.6
153.0
156.1
150.7
134.5
Feb-19
153.8
80.8
64.4
120.0
104.8
148.6
149.1
137.7
125.9
Mar-19
201.7
89.9
70.7
135.9
111.5
170.7
173.2
160.1
146.5
Apr-19
122.6
85.6
66.6
124.3
89.0
156.4
152.5
162.8
130.7
May-19
127.3
88.2
68.7
129.6
105.5
161.8
149.3
176.8
137.0
Jun-19
123.8
84.7
66.0
121.4
110.0
155.8
148.2
172.9
132.1
Jul-19
106.4
87.2
68.1
132.9
111.7
152.8
146.8
169.7
132.7
Aug-19
94.8
86.6
67.4
131.0
112.6
151.8
127.9
162.2
128.2

Growth Rates (in per cent)
Sector
Coal
Crude Oil
Natural Gas
Refinery Products
Fertilizers
Steel
Cement
Electricity
Overall Index
Weight
10.3335
8.9833
6.8768
28.0376
2.6276
17.9166
5.3720
19.8530
100.0000
Aug-18
2.4
-3.7
1.0
5.1
-5.3
4.0
14.6
7.6
4.7
Sep-18
6.4
-4.2
-1.7
2.5
2.5
3.2
11.8
8.2
4.3
Oct-18
11.3
-5.0
-0.9
1.3
-11.5
2.4
18.4
10.9
4.8
Nov-18
3.7
-3.5
0.5
2.3
-8.1
5.3
8.8
5.1
3.3
Dec-18
1.1
-4.3
4.2
-4.8
-2.4
10.1
11.6
4.4
2.1
Jan-19
2.0
-4.3
6.2
-2.6
10.5
5.5
11.0
0.8
1.5
Feb-19
7.4
-6.1
3.8
-0.8
2.5
4.9
8.0
1.2
2.2
Mar-19
9.1
-6.2
1.4
4.3
4.3
11.5
15.7
2.1
5.8
Apr-19
3.2
-6.7
-0.8
4.3
-4.4
13.3
2.3
5.9
5.2
May-19
1.7
-6.9
-0.1
-1.5
-1.0
13.3
2.8
7.4
3.8
Jun-19
3.2
-6.8
-2.1
-9.3
1.5
8.4
-1.7
8.1
0.7
Jul-19
-1.6
-4.4
-0.5
-0.9
1.5
8.9
7.9
4.7
2.7
Aug-19
-8.6
-5.4
-3.9
2.6
2.9
5.0
-4.9
-2.9
-0.5

*****

Monthly Production Report for August, 2019

Press Information Bureau
Government of India
Ministry of Petroleum & Natural Gas
26-September-2019 10:54 IST
Monthly Production Report for August, 2019
Crude Oil
During August, 2019 was 2749.92 TMT which is 6.04% lower than target and 5.44% lower when compared with August 2018. Cumulative crude oil production during April-August, 2019 was 13725.52 TMT which is 4.01% and 6.06% lower than target for the period and production during corresponding period of last year respectively. Unit-wise and State-wise crude oil production is given at Annexure-I. Unit-wise crude oil production for the month of August, 2019 and cumulatively for the period April-August, 2019 vis-à-vis same period of last year has been shown in Table-1

Index+of+eight+core

Table-1: Crude Oil Production (in TMT)

Oil Company
Target
August (Month)
April-August (Cumulative)
2019-20 (Apr-Mar)
2019-20
2018-19
% over last year
2019-20
2018-19
% over last year
Target
Prod.*
Prod.
Target
Prod.*
Prod.
ONGC
22153.90
1803.67
1716.89
1783.39
96.27
8760.07
8584.63
8964.83
95.76
OIL
3424.90
289.28
274.34
286.34
95.81
1415.66
1354.79
1411.41
95.99
PSC Fields
9463.34
833.84
758.68
838.40
90.49
4122.83
3786.10
4235.31
89.39
Total
35042.15
2926.79
2749.92
2908.13
94.56
14298.56
13725.52
14611.56
93.94
Note: Totals may not tally due to rounding off.                                       *: Provisional

यह भी पड़े  Index of Eight Core Industries (Base: 2011-12=100) March, 2019

Unit-wise production details with reasons for shortfall are as under:

1.  Crude oil production by ONGC during August, 2019 was 1716.89 TMT which is 4.81% lower than the target and 3.73% lower when compared with August, 2018. Cumulative crude oil production by ONGC during April-August, 2019 was 8584.63 TMT which is 2.0% and 4.24% lower than target for the period and production during corresponding period of last year respectively. Reasons for shortfall in production are as under:
  • ESP issues in wells of NBP field and Ratna R-series.
  • Increase in water cut in certain wells of Heera, Neelam, Mumbai High and B173A fields.
  • Sub-sea leakage in some well fluid lines of MH and NH Asset leading to flow restriction. NH Asset well fluid lines have been put back in operation after repair/replacement jobs. Repairing of well fluid lines of MH Asset is in progress.
2.  Crude oil production by OIL during August, 2019 was 274.34 TMT which is 5.16% lower than monthly target and 4.19% lower when compared with August, 2018. Cumulative crude oil production by OIL during April-August, 2019 was 1354.79 TMT which is 4.30% lower than target for the period and 4.01% lower than production during the corresponding period of last year. Major reasons for lower production is less than planned contribution from workover wells and drilling wells.
3.  Crude oil production by Pvt/JVs during August, 2019 was 758.68 TMT which is 9.01% lower than the monthly target and 9.51% lower than August, 2018. Cumulative crude oil production by Pvt/JVs during April-August, 2019 was 3786.10 TMT which is 8.17% lower than target for the period and 10.61% lower than the production during the corresponding period of last year. Reasons for shortfall in production are as under:
  • RJ-ON-90/1 (CEIL): Deficit is from Mangla due to delay in on lining of 45 Fatehgarh-Mangla-1 & 4 infill wells, ESP failure, drilling & work over activities and water leakage.
  • Operational issues in Bhagyam, Aishwarya and ABH fields.
  • CB-ONN-2005/9 (Mercator): Oil production from Jyoti-1 is stopped. Well closed for long term pressure build up study and could not be put back in production due to non-grant of EC for development campaign.
  • Jyoti-2 under WO from 31.03.19.
Natural Gas
Natural gas production during August, 2019 was 2688.23 MMSCM which is 7.18% lower than the monthly target and 3.58% lower when compared with August, 2018. Cumulative natural gas production during April-August, 2019 was 13437.00 MMSCM which is 5.49% lower than target for the period and 0.98% lower than production during corresponding period of last year Unit-wise and state-wise natural gas production is given at Annexure-II. Unit-wise natural gas production for the month of August, 2019 and cumulatively for the period April-August, 2019 vis-à-vis same period of last year has been shown in Table-2
Table-2: Natural Gas Production (MMSCM)

Oil
Company
Target
August (Month)
April-August (Cumulative)
2019-20 (Apr-Mar)
2019-20
2018-19
% over last year
2019-20
2018-19
% over last year
Target
Prod.*
Prod.
Target
Prod.*
Prod.
ONGC
25848.00
2124.66
2007.24
2060.68
97.41
10510.76
10158.29
10011.85
101.46
OIL
3309.59
288.16
236.93
236.97
99.98
1418.97
1152.66
1137.41
101.34
PSC Fields
5395.20
483.26
444.06
490.47
90.54
2287.57
2126.05
2421.20
87.81
Total
34552.79
2896.07
2688.23
2788.12
96.42
14217.31
13437.00
13570.46
99.02
1.   Natural gas production by ONGC during August, 2019 was 2007.24 MMSCM which is 5.53% lower than target and 2.59% lower when compared with August 2018. Cumulative natural gas production by ONGC during April-August, 2019 was 10158.29 MMSCM which is 1.46% higher than the production during the corresponding period of the last year but 3.35% lower than the cumulative target. Reasons for shortfall in production are as under:
  • Less gas production from Bassein and Satellite Asset due to de-optimization of certain wells.
  • Less off take from VA-S1 field in Eastern Offshore due to outage of GPPC and subsequent less offtake by M/s GAIL since 25th Aug’2019.
  • Less off take by consumers /Shut downs/ marketing issues.
  • Pressure decline in Pasarlapudi, Kesavadasupalem &Mandapeta fields in Rajahmundry and in Kuthalam& Kali fields in Cauvery Asset.
2.  Natural gas production by OIL during August, 2019 was 236.93 MMSCM which is 17.78% lower than monthly target and marginally lower by 0.02% when compared with August, 2018. Cumulative natural gas production by OIL during April-August, 2019 was 1152.66 MMSCM which is 1.34% higher than the production during the corresponding period of last year but 18.77% lower than the cumulative target. Reasons for shortfall in production are as under:
  • Loss of potential in Deohal area due to presence of CO2 in production stream.
  • Environmental loss (Bandh and miscreant activities).
  • Namrup Plant-II shut down due to disruption in process line of synthesis gas boiler outlet.
3.  Natural gas production by Pvt/JVs during August, 2019 was 444.06 MMSCM which is 8.11% lower than monthly target and 9.46% lower than August, 2018. Cumulative natural gas production by Pvt/JVs during April-August, 2019 was 2126.05 MMSCM which is 7.06% lower than the cumulative target and 12.19% lower than the production during the corresponding period of last year. Reasons for shortfall in production are as under:
  • KG-DWN-98/3 (RIL): MA field ceased production and closure of 2 wells in D1D3 field.
  • KG-OSN-2001/3 (ONGC): Delay in anticipated production from well DDW D-5.
  • RJ-ON/6(FEL): Less offtake by customer.
  • Raniganj East CBM Block (ESSAR): Major customer ‘Matix’ operational shutdown. Also restricted production to avoid flaring.
Refinery Production (in terms of crude oil processed)
Refinery production during August, 2019 was 21952.67 TMT which is 0.14% higher than the target for the month and 2.40% higher when compared with August, 2018. Cumulative production during April-August, 2019 was 106313.27 TMT which is 0.72% lower than the target for the period and 1.39% lower than the production during corresponding period of last year. Unit-wise production is given at Annexure-III. Company-wise production for the month of August, 2019 and cumulatively for the period April-August, 2019 vis-à-vis same period of last year has been shown in Table-3
Table 3: Refinery Production (TMT)
Oil Company
Target
August (Month)
April-August (Cumulative)
2019-20 (Apr-Mar)
2019-20
2018-19
% over last year
2019-20
2018-19
% over last year
Target
Prod.*
Prod.
Target
Prod.*
Prod.
CPSE
147944.81
12539.84
12492.89
12456.45
100.29
61632.99
60440.27
62492.31
96.72
IOCL
71900.25
6185.69
5959.36
5998.90
99.34
29985.91
29658.11
29776.70
99.60
BPCL
30900.00
2740.00
2746.77
2510.66
109.40
12640.00
12948.30
12898.99
100.38
HPCL
16499.00
1556.00
1563.13
1601.31
97.62
7581.00
7105.23
7720.99
92.02
CPCL
10400.00
780.00
898.16
954.19
94.13
4440.00
4445.33
4565.65
97.36
NRL
2799.80
259.10
243.13
271.49
89.56
1278.70
1183.41
1186.04
99.78
MRPL
15400.00
1015.00
1074.72
1115.38
96.35
5690.00
5063.27
6319.88
80.12
ONGC
45.76
4.06
7.62
4.52
168.62
17.39
36.62
24.07
152.13
JVs
18755.00
1588.00
1655.07
1188.27
139.28
7841.00
8505.54
7706.03
110.38
BORL
7800.00
660.00
670.33
153.96
435.40
3260.00
3246.69
2515.13
129.09
HMEL
10955.00
928.00
984.74
1034.31
95.21
4581.00
5258.85
5190.90
101.31
Private
88040.52
7793.13
7804.71
7793.13
100.15
37608.13
37367.46
37608.13
99.36
RIL
69145.00
6011.99
6022.14
6011.99
100.17
28796.42
28608.47
28796.42
99.35
EOL
18895.52
1781.15
1782.57
1781.15
100.08
8811.72
8759.00
8811.72
99.40
TOTAL
254740.32
21920.98
21952.67
21437.85
102.40
107082.12
106313.27
107806.47
98.61
Note: Totals may not tally due to rounding off.                     *: Provisional
1.  CPSE Refineries’ production during August, 2019 was 12492.89 TMT which is 0.37% lower than the target for the month but 0.29% higher when compared with August, 2018. Cumulative production by CPSE refineries during April-August, 2019 was 60440.27 TMT which is 1.94% lower than the target for the period and 3.28% lower than the production during corresponding period of last year. Reasons for shortfall of refinery production in some CPSE refineries are as under:

  •  IOCL, Gujarat: Lower due to AU-3 and AU-4 idled due to heavy rain and water logging , AU-5 idled due to high HSD stocks
  • IOCL, Haldia: Lower due to interruption in processing due to power failure
  • IOCL, Paradip: Lower due to high VR/VGO stocks.
  • IOCL, Bongaigaon: Lower due to crude receipt
  • IOCL, Panipat: Lower due to deferment of planned shutdown.
  • HPCL, Visakh: Lower due to interruption in crude supplies on account of SPM non-availability due to hose leak.

3.2    Production in JV refineries during August, 2019 was 1655.07 TMT which is 4.22% higher than the target for the month and 39.28% higher when compared with August, 2018. Cumulative production by JVs refineries during April-August, 2019 was 8505.54 TMT which is 8.48% higher than the target for the period and 10.38% higher than the production during corresponding period of last year.
3.3    Production in private refineries during August, 2019 was 7804.71 TMT which is higher by 0.15% than the target both for the month and corresponding month of last year. Cumulative production by private refineries during April-August, 2019 was 37367.46 TMT which is lower by 0.64% than the target and corresponding period of last year.
3.4    Refinery-wise details of the capacity utilization and production of petroleum products during the month of August, 2019 and cumulatively for the period April-August, 2019 vis-à-vis April-August, 2018 are given at Annexures – IV and V respectively.

*****

Index of Eight Core Industries (Base: 2011-12=100) June, 2019

Press Information Bureau
Government of India
Ministry of Commerce & Industry
31-July-2019 17:00 IST

Index of Eight Core Industries (Base: 2011-12=100) June, 2019

1.       The summary of the Index of Eight Core Industries (base: 2011-12) is given at the Annexure.

2.       The Eight Core Industries comprise 40.27 per cent of the weight of items included in the Index of Industrial Production (IIP). The combined Index of Eight Core Industries stood at 131.4 in June, 2019, which was 0.2 per cent higher as compared to the index of June, 2018. Its cumulative growth during April to June, 2019-20 was 3.5 per cent.

Index+of+eight+core+industries

Coal

3.       Coal production (weight: 10.33 per cent) increased by 3.2 per cent in June, 2019 over June, 2018. Its cumulative index increased by 2.7 per cent during April to June, 2019-20 over corresponding period of the previous year.

Crude Oil

4.       Crude Oil production (weight: 8.98 per cent) declined by 6.8 per cent in June, 2019 over June, 2018. Its cumulative index declined by 6.8 per cent during April to June, 2019-20 over the corresponding period of previous year.

Natural Gas

5.       The Natural Gas production (weight: 6.88 per cent) declined by 2.1 per cent in June, 2019 over June, 2018. Its cumulative index declined by 0.9 per cent during April to June, 2019-20 over the corresponding period of previous year.

Refinery Products

6.       Petroleum Refinery production (weight: 28.04 per cent) declined by 9.3 per cent in June, 2019 over June, 2018. Its cumulative index declined by 2.4 per cent during April to June, 2019-20 over the corresponding period of previous year.

Fertilizers

7.       Fertilizers production (weight: 2.63 per cent) increased by 1.5 per cent in June, 2019 over June, 2018. Its cumulative index declined by 1.1 per cent during April to June, 2019-20 over the corresponding period of previous year.

Steel

8.       Steel production (weight: 17.92 per cent) increased by 6.9 per cent in June, 2019 over June, 2018. Its cumulative index increased by 13.7 per cent during April to June, 2019-20 over the corresponding period of previous year.

Cement

9.       Cement production (weight: 5.37 per cent) declined by 1.5 per cent in June, 2019 over June, 2018. Its cumulative index increased by 1.2 per cent during April to June, 2019-20 over the corresponding period of previous year.

Electricity

10.     Electricity generation (weight: 19.85 per cent) increased by 7.3 per cent in June, 2019 over June, 2018. Its cumulative index increased by 6.9 per cent during April to June, 2019-20 over the corresponding period of previous year.

  • Note 1: Data for April, 2019, May, 2019 and June, 2019 are provisional.
  • Note 2: Since April, 2014, Electricity generation data from Renewable sources are also included.
  • Note 3: The industry-wise weights indicated above are individual industry weight derived from IIP and blown up on pro rata basis to a combined weight of ICI equal to 100.
  • Note 4: Since March 2019, a new steel product called Hot Rolled Pickled and Oiled (HRPO) under the item ‘Cold Rolled (CR) coils’ within the production of finished steel has also been included.
  • Note 5: Release of the index for July, 2019 will be on Monday, 2nd September, 2019.
Annexure
Performance of Eight Core Industries
Yearly Index & Growth Rate
Base Year: 2011-12=100
Index
Sector
Weight
2013-14
2014-15
2015-16
2016-17
2017-18
2018-19
Apr-Jun 2018-19
Apr-Jun 2019-20
Coal
10.3335
104.2
112.6
118.0
121.8
124.9
134.1
121.3
124.7
Crude Oil
8.9833
99.2
98.4
97.0
94.5
93.7
89.8
92.5
86.2
Natural Gas
6.8768
74.5
70.5
67.2
66.5
68.4
69.0
67.8
67.1
Refinery Products
28.0376
108.6
108.8
114.1
119.7
125.2
129.1
128.2
125.1
Fertilizers
2.6276
98.1
99.4
106.4
106.6
106.6
107.0
102.7
101.5
Steel
17.9166
115.8
121.7
120.2
133.1
140.5
147.7
141.6
160.9
Cement
5.3720
111.5
118.1
123.5
122.0
129.7
147.0
148.4
150.1
Electricity
19.8530
110.3
126.6
133.8
141.6
149.2
156.9
159.4
170.4
Overall Index
100.0000
106.5
111.7
115.1
120.5
125.7
131.2
129.1
133.7
Growth Rates (in per cent)
Sector
Weight
2013-14
2014-15
2015-16
2016-17
2017-18
2018-19
Apr-Jun 2018-19
Apr-Jun 2019-20
Coal
10.3335
1.0
8.0
4.8
3.2
2.6
7.4
12.9
2.7
Crude Oil
8.9833
-0.2
-0.9
-1.4
-2.5
-0.9
-4.1
-2.4
-6.8
Natural Gas
6.8768
-12.9
-5.3
-4.7
-1.0
2.9
0.8
0.4
-0.9
Refinery Products
28.0376
1.4
0.2
4.9
4.9
4.6
3.1
6.6
-2.4
Fertilizers
2.6276
1.5
1.3
7.0
0.2
0.03
0.3
4.5
-1.1
Steel
17.9166
7.3
5.1
-1.3
10.7
5.6
5.1
2.3
13.7
Cement
5.3720
3.7
5.9
4.6
-1.2
6.3
13.3
16.3
1.2
Electricity
19.8530
6.1
14.8
5.7
5.8
5.3
5.2
4.8
6.9
Overall Index
100.0000
2.6
4.9
3.0
4.8
4.3
4.4
5.5
3.5
Performance of Eight Core Industries

Monthly Index & Growth Rate
Base Year: 2011-12=100

Index
Sector Coal Crude Oil Natural Gas Refinery Products Fertilizers Steel Cement Electricity Overall Index
Weight
10.3335
8.9833
6.8768
28.0376
2.6276
17.9166
5.3720
19.8530
100.0000
Jun-18
120.0
90.9
67.4
133.8
108.3
143.8
150.7
159.9
131.2
Jul-18
108.1
91.2
68.5
134.1
110.0
140.3
136.0
162.1
129.2
Aug-18
103.8
91.6
70.2
127.7
109.4
144.5
134.5
167.2
128.8
Sep-18
109.8
88.1
67.6
125.8
108.0
143.2
133.9
162.9
127.2
Oct-18
132.9
90.9
70.3
133.8
103.3
150.2
148.4
166.0
134.8
Nov-18
138.4
87.6
68.9
128.9
102.7
144.8
136.5
147.2
128.3
Dec-18
144.1
90.2
72.2
126.6
109.4
152.0
151.0
150.3
131.5
Jan-19
152.5
89.7
71.8
131.9
116.6
153.0
156.1
150.7
134.5
Feb-19
153.8
80.8
64.4
120.0
104.8
148.6
149.1
137.7
125.9
Mar-19
201.7
89.9
70.7
135.9
111.5
170.7
173.2
160.1
146.5
Apr-19
122.6
85.6
66.6
124.3
89.0
164.3
152.5
162.9
132.1
May-19
127.6
88.2
68.7
129.6
105.5
164.7
149.3
176.9
137.6
Jun-19
123.8
84.7
66.0
121.4
110.0
153.7
148.5
171.6
131.4
Growth Rates (in per cent)
Sector Coal Crude Oil Natural Gas Refinery Products Fertilizers Steel Cement Electricity Overall Index
Weight
10.3335
8.9833
6.8768
28.0376
2.6276
17.9166
5.3720
19.8530
100.0000
Jun-18
11.5
-3.4
-2.7
12.1
1.0
4.2
14.2
8.4
7.8
Jul-18
9.8
-5.4
-5.2
12.3
1.3
6.9
11.2
6.7
7.3
Aug-18
2.4
-3.7
1.0
5.1
-5.3
4.0
14.6
7.6
4.7
Sep-18
6.4
-4.2
-1.7
2.5
2.5
3.2
11.8
8.2
4.3
Oct-18
11.3
-5.0
-0.9
1.3
-11.5
2.4
18.4
10.9
4.8
Nov-18
3.7
-3.5
0.5
2.3
-8.1
5.3
8.8
5.1
3.3
Dec-18
1.1
-4.3
4.2
-4.8
-2.4
10.1
11.6
4.4
2.1
Jan-19
2.0
-4.3
6.2
-2.6
10.5
5.5
11.0
0.8
1.5
Feb-19
7.4
-6.1
3.8
-0.8
2.5
4.9
8.0
1.2
2.2
Mar-19
9.1
-6.2
1.4
4.3
4.3
11.5
15.7
2.1
5.8
Apr-19
3.2
-6.7
-0.8
4.3
-4.4
19.0
2.3
5.9
6.3
May-19
1.9
-6.9
0.0
-1.5
-1.0
15.3
2.8
7.4
4.3
Jun-19
3.2
-6.8
-2.1
-9.3
1.5
6.9
-1.5
7.3
0.2
*****

Index of Eight Core Industries (Base: 2011-12=100) May, 2019

Press Information Bureau
Government of India
Ministry of Commerce & Industry
01 JUL 2019 5:00PM 

Index of Eight Core Industries (Base: 2011-12=100) May, 2019
1.       The summary of the Index of Eight Core Industries (base: 2011-12) is given at the Annexure.

2.       The Eight Core Industries comprise 40.27 per cent of the weight of items included in the Index of Industrial Production (IIP). The combined Index of Eight Core Industries stood at 138.7 in May, 2019, which was 5.1 per cent higher as compared to the index of May, 2018. Its cumulative growth during April to May, 2019-20 was 5.7 per cent.

Index+of+Eight+Core+Industries

Coal

  • Coal production (weight: 10.33 per cent) increased by 1.8 per cent in May, 2019 over May, 2018. Its cumulative index increased by 2.5 per cent during April to May, 2019-20 over corresponding period of the previous year.

Crude Oil

  • Crude Oil production (weight: 8.98 per cent) declined by 6.9 per cent in May, 2019 over May, 2018. Its cumulative index declined by 6.8 per cent during April to May, 2019-20 over the corresponding period of previous year.

Natural Gas

  • The Natural Gas production (weight: 6.88 per cent) growth stood at 0.0 per cent in May, 2019 over May, 2018. Its cumulative index declined by 0.4 per cent during April to May, 2019-20 over the corresponding period of previous year.

Refinery Products

  • Petroleum Refinery production (weight: 28.04 per cent) declined by 1.5 per cent in May, 2019 over May, 2018. Its cumulative index increased by 1.3 per cent during April to May, 2019-20 over the corresponding period of previous year.

Fertilizers

  • Fertilizers production (weight: 2.63 per cent) declined by 1.0 per cent in May, 2019 over May, 2018. Its cumulative index declined by 2.6 per cent during April to May, 2019-20 over the corresponding period of previous year.

Steel

  • Steel production (weight: 17.92 per cent) increased by 19.9 per cent in May, 2019 over May, 2018. Its cumulative index increased by 19.4 per cent during April to May, 2019-20 over the corresponding period of previous year.

Cement

  • Cement production (weight: 5.37 per cent) increased by 2.8 per cent in May, 2019 over May, 2018. Its cumulative index increased by 2.5 per cent during April to May, 2019-20 over the corresponding period of previous year.

Electricity

  • Electricity generation (weight: 19.85 per cent) increased by 7.2 per cent in May, 2019 over May, 2018. Its cumulative index increased by 6.6 per cent during April to May, 2019-20 over the corresponding period of previous year.

Note :

  • Data for March, 2019, April, 2019 and May, 2019 are provisional.
  • Since April, 2014, Electricity generation data from Renewable sources are also included.
  • The industry-wise weights indicated above are individual industry weight derived from IIP and blown up on pro rata basis to a combined weight of ICI equal to 100.
  • Release of the index for June, 2019 will be on Wednesday, 31st July, 2019.
Annexure
Performance of Eight Core Industries
Yearly Index & Growth Rate
Base Year: 2011-12=100

Index
Sector
Weight
2013-14
2014-15
2015-16
2016-17
2017-18
2018-19
Apr-May 2018-19
Apr- May 2019-20
Coal
10.3335
104.2
112.6
118.0
121.8
124.9
134.1
122.0
125.1
Crude Oil
8.9833
99.2
98.4
97.0
94.5
93.7
89.8
93.3
86.9
Natural Gas
6.8768
74.5
70.5
67.2
66.5
68.4
69.0
67.9
67.7
Refinery Products
28.0376
108.6
108.8
114.1
119.7
125.2
129.1
125.4
126.9
Fertilizers
2.6276
98.1
99.4
106.4
106.6
106.6
107.0
99.9
97.3
Steel
17.9166
115.8
121.7
120.2
133.1
140.5
147.1
140.4
167.7
Cement
5.3720
111.5
118.1
123.5
122.0
129.7
147.0
147.2
150.9
Electricity
19.8530
110.3
126.6
133.8
141.6
149.2
156.9
159.2
169.7
Overall Index
100.0000
106.5
111.7
115.1
120.5
125.7
131.1
128.1
135.4
Growth Rates (in per cent)
Sector
Weight
2013-14
2014-15
2015-16
2016-17
2017-18
2018-19
Apr- May 2018-19
Apr-May 2019-20
Coal
10.3335
1.0
8.0
4.8
3.2
2.6
7.4
13.6
2.5
Crude Oil
8.9833
-0.2
-0.9
-1.4
-2.5
-0.9
-4.1
-1.9
-6.8
Natural Gas
6.8768
-12.9
-5.3
-4.7
-1.0
2.9
0.8
2.0
-0.4
Refinery Products
28.0376
1.4
0.2
4.9
4.9
4.6
3.1
3.9
1.3
Fertilizers
2.6276
1.5
1.3
7.0
0.2
0.03
0.3
6.6
-2.6
Steel
17.9166
7.3
5.1
-1.3
10.7
5.6
4.7
1.4
19.4
Cement
5.3720
3.7
5.9
4.6
-1.2
6.3
13.3
17.3
2.5
Electricity
19.8530
6.1
14.8
5.7
5.8
5.3
5.2
3.1
6.6
Overall Index
100.0000
2.6
4.9
3.0
4.8
4.3
4.3
4.4
5.7
Performance of Eight Core Industries
Monthly Index & Growth Rate
Base Year: 2011-12=100

Index
Sector Coal Crude Oil Natural Gas Refinery Products Fertilizers Steel Cement Electricity Overall Index
Weight
10.3335
8.9833
6.8768
28.0376
2.6276
17.9166
5.3720
19.8530
100.0000
May-18
125.2
94.8
68.7
131.6
106.6
142.8
145.3
164.7
131.9
Jun-18
120.0
90.9
67.4
133.8
108.3
143.8
150.7
159.9
131.2
Jul-18
108.1
91.2
68.5
134.1
110.0
140.3
136.0
162.1
129.2
Aug-18
103.8
91.6
70.2
127.7
109.4
144.5
134.5
167.2
128.8
Sep-18
109.8
88.1
67.6
125.8
108.0
143.2
133.9
162.9
127.2
Oct-18
132.9
90.9
70.3
133.8
103.3
150.2
148.4
166.0
134.8
Nov-18
138.4
87.6
68.9
128.9
102.7
144.8
136.5
147.2
128.3
Dec-18
144.1
90.2
72.2
126.6
109.4
152.0
151.0
150.3
131.5
Jan-19
152.5
89.7
71.8
131.9
116.6
153.0
156.1
150.7
134.5
Feb-19
153.8
80.8
64.4
120.0
104.8
148.6
149.1
137.7
125.9
Mar-19
201.7
89.9
70.7
135.9
111.5
163.4
173.2
160.1
145.2
Apr-19
122.6
85.6
66.6
124.3
89.0
164.3
152.5
162.9
132.1
May-19
127.5
88.2
68.7
129.6
105.5
171.1
149.3
176.6
138.7
Growth Rates (in per cent)
Sector Coal Crude Oil Natural Gas Refinery Products Fertilizers Steel Cement Electricity Overall Index
Weight
10.3335
8.9833
6.8768
28.0376
2.6276
17.9166
5.3720
19.8530
100.0000
May-18
12.0
-2.9
-1.4
4.9
8.4
-0.1
13.0
4.1
4.1
Jun-18
11.5
-3.4
-2.7
12.1
1.0
4.2
14.2
8.4
7.8
Jul-18
9.8
-5.4
-5.2
12.3
1.3
6.9
11.2
6.7
7.3
Aug-18
2.4
-3.7
1.0
5.1
-5.3
4.0
14.6
7.6
4.7
Sep-18
6.4
-4.2
-1.7
2.5
2.5
3.2
11.8
8.2
4.3
Oct-18
11.3
-5.0
-0.9
1.3
-11.5
2.4
18.4
10.9
4.8
Nov-18
3.7
-3.5
0.5
2.3
-8.1
5.3
8.8
5.1
3.3
Dec-18
1.1
-4.3
4.2
-4.8
-2.4
10.1
11.6
4.4
2.1
Jan-19
2.0
-4.3
6.2
-2.6
10.5
5.5
11.0
0.8
1.5
Feb-19
7.4
-6.1
3.8
-0.8
2.5
4.9
8.0
1.2
2.2
Mar-19
9.1
-6.2
1.4
4.3
4.3
6.7
15.7
2.1
4.9
Apr-19
3.2
-6.7
-0.8
4.3
-4.4
19.0
2.3
5.9
6.3
May-19
1.8
-6.9
0.0
-1.5
-1.0
19.9
2.8
7.2
5.1

*****

Index of Eight Core Industries (Base: 2011-12=100) February, 2019

Press Information Bureau 
Government of India
Ministry of Commerce & Industry
01-April-2019 17:00 IST

Index of Eight Core Industries (Base: 2011-12=100) February, 2019 
1. The summary of the Index of Eight Core Industries (base: 2011-12) is given at the Annexure.

2. The Eight Core Industries comprise 40.27 per cent of the weight of items included in the Index of Industrial Production (IIP). The combined Index of Eight Core Industries stood at 125.8 in February, 2019, which was 2.1 percent higher as compared to the index of February, 2018. Its cumulative growth during April to February, 2018-19 was 4.3 percent.

Coal

3. Coal production (weight: 10.33 percent)increased by 7.3 per cent in February, 2019 over February, 2018. Its cumulative index increased by 7.1 percent during April to February, 2018-19 over corresponding period of the previous year.
Index+of+Eight+Core+Industries
Crude Oil

4. Crude Oil production (weight: 8.98 percent) declined by 6.1 per cent in February, 2019 over February, 2018. Its cumulative index declined by 4.0 percent during April to February, 2018-19 over the corresponding period of previous year.

Natural Gas

5. The Natural Gas production (weight: 6.88 percent) increased by 3.8 percent in February, 2019 over February, 2018. Its cumulative index increased by 0.8 percent during April to February, 2018-19 over the corresponding period of previous year.

Refinery Products

6. Petroleum Refinery production (weight: 28.04 percent) declined by 0.8 per cent in February, 2019 over February, 2018. Its cumulative index increased by 3.0 percent during April to February, 2018-19 over the corresponding period of previous year.

Fertilizers

7. Fertilizers production (weight: 2.63 per cent) increased by 2.5 per cent in February, 2019 over February, 2018. Its cumulative index declined by 0.02 percent during April to February, 2018-19 over the corresponding period of previous year.

Steel

8. Steel production (weight: 17.92 percent) increased by 4.9 per cent in February, 2019 over February, 2018. Its cumulative index increased by 4.7 percent during April to February, 2018-19 over the corresponding period of previous year.

Cement

9. Cement production (weight: 5.37 percent) increased by 8.0 percent in February, 2019 over February, 2018. Its cumulative index increased by 13.0 percent during April to February, 2018-19 over the corresponding period of previous year.

Electricity

10. Electricity generation (weight: 19.85 percent) increased by 0.7 percent in February, 2019 over February, 2018. Its cumulative index increased by 5.4 percent during April to February, 2018-19 over the corresponding period of previous year.

Note 1: Data for December, 2018, January, 2019 and February, 2019 are provisional.
Note 2: Since April, 2014, Electricity generation data from Renewable sources are also included.
Note 3: The industry-wise weights indicated above are individual industry weight derived from IIP and blown up on prorata basis to a combined weight of ICI equal to 100.
Note 4: Release of the index for March, 2019 will be on Tuesday, 30th April, 2019.

Annexure
Performance of Eight Core Industries
Yearly Index & Growth Rate
Base Year: 2011-12=100

Index
Sector
Weight
2012-13
2013-14
2014-15
2015-16
2016-17
2017-18
Apr-Feb 2017-18
Apr-Feb 2018-19
Coal
10.3335
103.2
104.2
112.6
118.0
121.8
124.9
119.4
127.9
Crude Oil
8.9833
99.4
99.2
98.4
97.0
94.5
93.7
93.5
89.8
Natural Gas
6.8768
85.6
74.5
70.5
67.2
66.5
68.4
68.3
68.8
Refinery Products
28.0376
107.2
108.6
108.8
114.1
119.7
125.2
124.7
128.5
Fertilizers
2.6276
96.7
98.1
99.4
106.4
106.6
106.6
106.6
106.6
Steel
17.9166
107.9
115.8
121.7
120.2
133.1
140.5
139.4
145.9
Cement
5.3720
107.5
111.5
118.1
123.5
122.0
129.7
127.9
144.6
Electricity
19.8530
104.0
110.3
126.6
133.8
141.6
149.2
148.5
156.5
Overall Index
100.0000
103.8
106.5
111.7
115.1
120.5
125.7
124.5
129.8


Growth Rates(in per cent)

Sector
Weight
2012-13
2013-14
2014-15
2015-16
2016-17
2017-18
Apr-Feb 2017-18
Apr-Feb 2018-19
Coal
10.3335
3.2
1.0
8.0
4.8
3.2
2.6
1.7
7.1
Crude Oil
8.9833
-0.6
-0.2
-0.9
-1.4
-2.5
-0.9
-0.8
-4.0
Natural Gas
6.8768
-14.4
-12.9
-5.3
-4.7
-1.0
2.9
3.0
0.8
Refinery Products
28.0376
7.2
1.4
0.2
4.9
4.9
4.6
4.9
3.0
Fertilizers
2.6276
-3.3
1.5
1.3
7.0
0.2
0.03
-0.2
-0.02
Steel
17.9166
7.9
7.3
5.1
-1.3
10.7
5.6
5.7
4.7
Cement
5.3720
7.5
3.7
5.9
4.6
-1.2
6.3
5.6
13.0
Electricity
19.8530
4.0
6.1
14.8
5.7
5.8
5.3
5.3
5.4
Overall Index
100.0000
3.8
2.6
4.9
3.0
4.8
4.3
4.3
4.3

Performance of Eight Core Industries
Monthly Index & Growth Rate
Base Year: 2011-12=100

Index
Sector Coal Crude Oil Natural Gas Refinery Products Fertilizers Steel Cement Electricity Overall Index
Weight
10.3335
8.9833
6.8768
28.0376
2.6276
17.9166
5.3720
19.8530
100.0000
Feb-18
143.2
86.1
62.1
120.9
102.2
141.7
138.0
136.1
123.2
Mar-18
184.9
95.8
69.8
130.3
107.0
153.2
149.6
156.7
138.5
Apr-18
118.8
91.8
67.1
119.1
93.1
138.1
149.1
153.7
124.3
May-18
125.2
94.8
68.7
131.6
106.6
142.8
145.3
164.7
131.9
Jun-18
120.0
90.9
67.4
133.8
108.3
143.8
150.7
159.9
131.2
Jul-18
108.1
91.2
68.5
134.1
110.0
140.3
136.0
162.1
129.2
Aug-18
103.8
91.6
70.2
127.7
109.4
144.5
134.5
167.2
128.8
Sep-18
109.8
88.1
67.6
125.8
108.0
143.2
133.9
162.9
127.2
Oct-18
132.9
90.9
70.3
133.8
103.3
150.2
148.4
166.0
134.8
Nov-18
138.4
87.6
68.9
128.9
102.7
144.8
136.5
147.2
128.3
Dec-18
144.1
90.2
72.2
126.6
109.4
155.8
151.0
150.3
132.2
Jan-19
152.1
89.7
71.8
131.9
116.6
153.0
156.1
150.7
134.5
Feb-19
153.6
80.8
64.4
120.0
104.8
148.6
149.1
137.1
125.8
Growth Rates (in per cent)
Sector Coal Crude Oil Natural Gas Refinery Products Fertilizers Steel Cement Electricity Overall Index
Weight
10.3335
8.9833
6.8768
28.0376
2.6276
17.9166
5.3720
19.8530
100.0000
Feb-18
1.3
-2.4
-1.8
7.8
5.2
5.0
23.0
4.6
5.4
Mar-18
9.1
-1.6
1.0
1.1
3.2
4.7
13.5
6.0
4.5
Apr-18
15.2
-0.8
5.7
2.7
4.6
3.0
21.9
2.1
4.7
May-18
12.0
-2.9
-1.4
4.9
8.4
-0.1
13.0
4.1
4.1
Jun-18
11.5
-3.4
-2.7
12.1
1.0
4.2
14.2
8.4
7.8
Jul-18
9.8
-5.4
-5.2
12.3
1.3
6.9
11.2
6.7
7.3
Aug-18
2.4
-3.7
1.0
5.1
-5.3
4.0
14.6
7.6
4.7
Sep-18
6.4
-4.2
-1.7
2.5
2.5
3.2
11.8
8.2
4.3
Oct-18
11.3
-5.0
-0.9
1.3
-11.5
2.4
18.4
10.9
4.8
Nov-18
3.7
-3.5
0.5
2.3
-8.1
5.3
8.8
5.1
3.3
Dec-18
1.1
-4.3
4.2
-4.8
-2.4
12.9
11.6
4.4
2.7
Jan-19
1.7
-4.3
6.2
-2.6
10.5
5.5
11.0
0.8
1.5
Feb-19
7.3
-6.1
3.8
-0.8
2.5
4.9
8.0
0.7
2.1
*****
Share via
Copy link