Consumer Price Index for Industrial Workers (2016=100) – April, 2023

Consumer Price Index for Industrial Workers (2016=100) – April, 2023
Ministry of Labour & Employment

Consumer Price Index for Industrial Workers (2016=100) – April, 2023
Posted On: 31 MAY 2023 9:00PM by PIB Delhi
The Labour Bureau, an attached office of the M/o Labour & Employment, has been compiling Consumer Price Index for Industrial Workers every month on the basis of retail prices collected from 317 markets spread over 88 industrially important centres in the country. The index is compiled for 88 centres and All-India and is released on the last working day of succeeding month. The index for the month of April, 2023 is being released in this press release.
The All-India CPI-IW for April, 2023 increased by 0.9 points and stood at 134.2 (one hundred thirty four point two). On 1-month percentage change, it increased by 0.68 per cent with respect to previous month compared to increase of 1.35 per cent recorded between corresponding months a year ago.
The maximum upward pressure in current index came from Food & Beverages group contributing 0.39 percentage points to the total change. At item level, Rice, Arhar Dal, Apple, Banana, Orange, Cauliflower, Brinjal, Cabbage, Ginger, Peas, Dairy Milk, French bean, Lemon, Cumin seed/Jira, Chillies dry, Cooked Meal, Poultry Chicken, Ladies Suiting, etc. are responsible for the rise in index. However, this increase was largely checked by Wheat Atta, Tomato, Onion, Drum Stick, Lady’s Finger, Mango, Soyabean Oil, Sunflower Oil, Mustard Oil, Egg-Hen, Electricity Domestic, Firewood and Chips, etc. putting downward pressure on the index.
At centre level, Howrah recorded a maximum increase of 4.1 points. Among others, 4 centres recorded increase between 2 to 2.9 points, 30 centres between 1 to 1.9 points and 37 centres between 0.1 to 0.9 points. On the contrary, Salem recorded a maximum decrease of 1.9 points. Among others, 11 centers recorded decrease between 0.1 to 0.9 points. Rest of four centers index remained stationary.
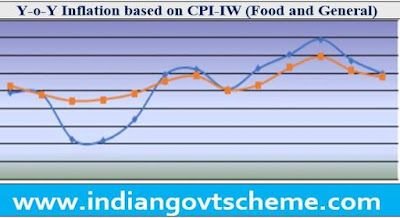
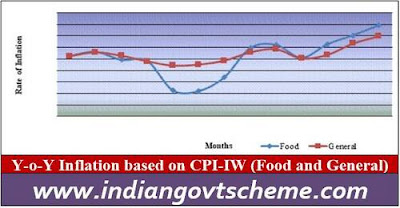
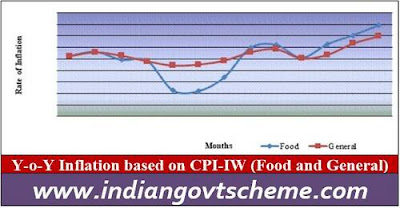
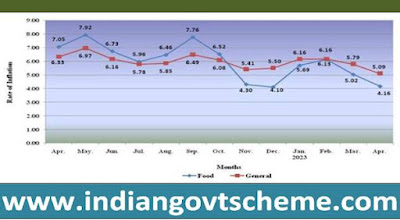
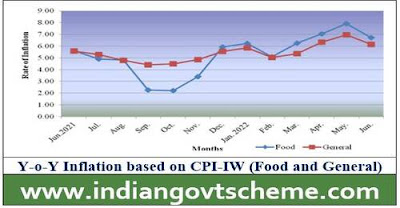
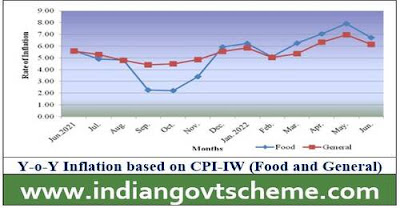
Year-on-year inflation for the month stood at 5.09 per cent compared to 5.79 per cent for the previous month and 6.33 per cent during the corresponding month a year before. Similarly, Food inflation stood at 4.16 per cent against 5.02 per cent of the previous month and 7.05 per cent during the corresponding month a year ago.
Y-o-Y Inflation based on CPI-IW (Food and General)
Inflation based on CPI-IW (Food and General)
All-India Group-wise CPI-IW for March, 2023 and April, 2023

Sr. No.

Groups

March, 2023

April, 2023

I

Food & Beverages

131.7

132.8

II

Pan, Supari, Tobacco & Intoxicants

153.8

154.7

III

Clothing & Footwear

133.3

136.1

IV

Housing

123.4

123.4

V

Fuel & Light

182.2

182.1

VI

Miscellaneous

131.1

131.9

General Index

133.3

134.2

CPI-IW: Groups Indices
The next issue of CPI-IW for the month of May, 2023 will be released on Friday, 30th June, 2023. The same will also be available on the office website www.labourbureau.gov.in.

नोट :- हमारे वेबसाइट www.indiangovtscheme.com पर ऐसी जानकारी रोजाना आती रहती है, तो आप ऐसी ही सरकारी योजनाओं की जानकारी पाने के लिए हमारे वेबसाइट www.indiangovtscheme.com से जुड़े रहे।

*****
लेटेस्‍ट अपडेट के लिए  FacebookTwitterTelegram से  अवश्‍य जुड़ें

Consumer Price Index for Industrial Workers (2016=100) – January, 2023 औदयोगिक श्रमिकों का उपभोक्ता मूल्य सूचकांक (2016-100) – जनवरी, 2023

Consumer Price Index for Industrial Workers (2016=100) – January, 2023 औदयोगिक श्रमिकों का उपभोक्ता मूल्य सूचकांक (2016-100) – जनवरी, 2023

भारत सरकार
श्रम एवं रोज़गार मंत्रालय
श्रम ब्यूरो
‘क्लेरमॉन्ट’ शिमला- 171004
दिनांक: 28 फरवरी, 2023
संख्या- 5/1/2021- सी.पी.आई.
प्रेस विजप्ति

औदयोगिक श्रमिकों का उपभोक्ता मूल्य सूचकांक (2016-100) – जनवरी, 2023
श्रम ब्यूरो, श्रम एवं रोज़गार मंत्रालय से संबंधित कार्यालय द्वारा हर महीने औदयोगिक श्रमिकों के लिए उपभोक्ता मूल्य सूचकांक का संकलन सम्पूर्ण देश में फैले हुए 88 महत्वपूर्ण औदयोगिक केंद्रों के 317 बाजारों से एकब्रित खुदरा मूल्यों के आधार पर किया जाता है। सूचकांक का संकलन 88 औद्योगिक केंद्रों एवं अखिल भारत के लिए किया जाता है और आगामी महीने के अंतिम कार्यदिवस पर जारी किया जाता है। जनवरी, 2023 के लिए सूचकांक इस प्रेस विज़प्ति के माध्यम से जारी किया जा रहा है।
Consumer Price Index for Industrial Workers
जनवरी, 2023 का अखिल भारत उपभोक्ता मूल्य सूचकांक (औदयोगिक श्रमिक) 0.5 अंक बढ़कर 132.8 (एक सौ बत्तीस दशमलव आठ) अंकों के स्तर पर संकलित हुआ। सूचकांक में पिछले माह की तुलना में 0.38 प्रतिशत की वृद्धि रही जबकि एक वर्ष पूर्व इन्हीं दो महीनों के बीच 0.24 प्रतिशत की कमी दर्ज की गई थी।
सूचकांक में दर्ज वृद्धि में अधिकतम योगदान आवास समूह का रहा जिसने कुल बदलाव को 0.40 बिन्दु प्रतिशतता से प्रभावित किया। मदों में, मकान किराया, गेंहू, गेंह्‌ आटा, गाय का दूध, सेब, केला, संतरा, बेगन, भिंडी, कंदरु, मुर्गी के अंडे, जीरा, तैयार भोजन, तैयार पान, ज़र्दा, मेडिसन ऐलोपेथिक, नहाने का साबुन, इत्यादि सूचकांक को बढ़ाने में सहायक रहे। इसके विपरित मुख्यतः आलू, फ्रेंच बीन, हरा धनिया, मूली, टमाटर, सूरजमुखी का तेल, सोयाबीन का तेल, पोल्ट्री चिकन, आदि ने सूचकांक में दर्ज वृद्धि को नियंत्रित करने का प्रयास किया।
केंद्र-स्तर पर कोयंबटूर के सूचकांक में अधिकतम 3.0 अंक की वृद्धि दर्ज की गई। अन्य 3 केंद्रों में 2 से 2.1 अंक, 14 केंद्रों में | से 1.9 अंक तथा 39 केंद्रों में 01 से 0.9 अंक के बीच वृद्धि रही। इसके विपरीत, लबाक सिलचर में अधिकतम 1.5 अंक की कमी रही| अन्य 4 केंद्रों में 1 से 1.3 अंक तथा 21 केंद्रों में 011 से 0.9 अंक तक की कमी दर्ज की गई | शेष पाँच केंद्रों का सूचकांक स्थिर रहा।
जनवरी, 2023 के लिए मुद्रास्फीति दर पिछले महीने के 5.50 प्रतिशत तथा गत वर्ष के इसी माह के 5.84 प्रतिशत की तुलना में 6.16 प्रतिशत रहा। खादय-स्फीति दर पिछले माह के 4.10 प्रतिशत एवं एक वर्ष पूर्व इसी माह के 6.22 प्रतिशत की तुलना में 5.69 प्रतिशत रहा।
(श्याम सिंह नेगी)
उप महानिदेशक

नोट :- हमारे वेबसाइट www.indiangovtscheme.com पर ऐसी जानकारी रोजाना आती रहती है, तो आप ऐसी ही सरकारी योजनाओं की जानकारी पाने के लिए हमारे वेबसाइट www.indiangovtscheme.com से जुड़े रहे।
*****
लेटेस्‍ट अपडेट के लिए  FacebookTwitterTelegram से  अवश्‍य जुड़ें

Consumer Price Index for Industrial Workers for December, 2022 released

Consumer Price Index for Industrial Workers for December, 2022 released

Ministry of Labour & Employment

Consumer Price Index for Industrial Workers for December, 2022 released

Posted On: 31 JAN 2023 6:58PM by PIB Delhi
The Labour Bureau, an attached office of the Ministry of Labour & Employment, has been compiling Consumer Price Index for Industrial Workers every month on the basis of retail prices collected from 317 markets spread over 88 industrially important centres in the country. The index is compiled for 88 centres and All-India and is released on the last working day of succeeding month.
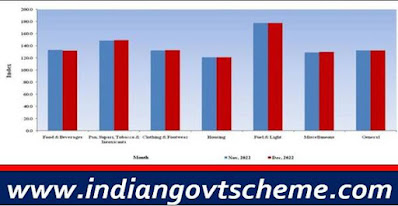
Consumer Price Index for Industrial Workers for December
The All-India CPI-IW for December, 2022 decreased by 0.2 points and stood at 132.3 (one thirty two point three) points. On 1-month percentage change, it decreased by 0.15 per cent with respect to previous month compared to decrease of 0.24 per cent recorded between corresponding months a year ago.
The maximum downward pressure in current index came from Food & Beverages group contributing 0.52 percentage points to the total change. At item level, Cabbage, Cauliflower, Brinjal, Carrot, Onion, Potato, Tomato, Peas, Garlic, Chilies Green, Apple, Orange, Sunflower Oil, Vanaspati Oil and Poultry/Chicken etc. are responsible for the fall in index. However, this decrease was checked by Rice, Wheat Atta, Wheat, Cow Milk, Fish Fresh, Egg-Hen, Drum stick, Chilies Dry, Cumin Seed/Jira, Turmeric, Tea Leaf, Cooked Meals, ESI Contribution, Medicine Allopathic and Tuition and other fees school/ITI etc. putting upward pressure on the index.
At centre level, Lucknow and Nasik recorded a maximum decrease of 1.9 points each. Among others, 19 centres recorded decrease between 1 to 1.8 points and 37 centres between 0.1 to 0.9 points. On the contrary, Faridabad recorded a maximum increase of 3.3 points followed by Nagpur and Tiruneveli with 3.0 and 2.4 points respectively. Among others, 4 centres recorded increase between 1 to 1.7 points and 21 centres between 0.1 to 0.9 points. Rest of 2 centres’ indices remained stationary.
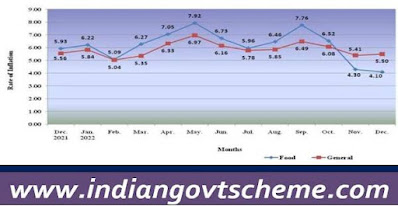
Year-on-year inflation for the month stood at 5.50 per cent compared to 5.41 per cent for the previous month and 5.56 per cent during the corresponding month a year before. Similarly, Food inflation stood at 4.10 per cent against 4.30 per cent of the previous month and 5.93 per cent during the corresponding month a year ago.
Y-o-Y Inflation based on CPI-IW (Food and General)
All-India Group-wise CPI-IW for November, 2022 and December, 2022
Sr. No.
Groups
November
, 2022
December
, 2022

I
Food & Beverages

133.3

132.0

II
Pan, Supari, Tobacco & Intoxicants

148.7

149.2

III
Clothing & Footwear

132.3

132.8

IV
Housing

121.0

121.0

V
Fuel & Light

177.8

177.8

VI
Miscellaneous

129.1

130.0
General Index
132.5
132.3
CPI-IW: Groups Indices
The next issue of CPI-IW for the month of January, 2023 will be released on Tuesday, 28th February, 2023. The same will also be available on the office website www.labourbureaunew.gov.in.

नोट :- हमारे वेबसाइट www.indiangovtscheme.com पर ऐसी जानकारी रोजाना आती रहती है, तो आप ऐसी ही सरकारी योजनाओं की जानकारी पाने के लिए हमारे वेबसाइट www.indiangovtscheme.com से जुड़े रहे।

*****
लेटेस्‍ट अपडेट के लिए  FacebookTwitterTelegram से  अवश्‍य जुड़ें

Consumer Price Index for Industrial Workers for October, 2022 : All-India CPI-IW for October, 2022 increased by 1.2 points and stood at 132.5

Consumer Price Index for Industrial Workers for October, 2022 : All-India CPI-IW for October, 2022 increased by 1.2 points and stood at 132.5
 
Ministry of Labour & Employment
Consumer Price Index for Industrial Workers for October, 2022 released
 
All-India CPI-IW for October, 2022 increased by 1.2 points and stood at 132.5
Posted On: 30 NOV 2022 6:28PM by PIB Delhi
The Labour Bureau, an attached office of the Ministry Labour and Employment, has been compiling Consumer Price Index for Industrial Workers every month on the basis of retail prices collected from 317 markets spread over 88 industrially important centres in the country. The index is compiled for 88 centres and All-India and is released on the last working day of succeeding month. The index for the month of October, 2022 was released today
The All-India CPI-IW for October, 2022 increased by 1.2 points and stood at 132.5 (one hundred thirty two point five). On 1-month percentage change, it increased by 0.91 per cent with respect to previous month compared to an increase of 1.30 per cent recorded between corresponding months a year ago.
The maximum upward pressure in current index came from Food & Beverages group contributing 0.76 percentage points to the total change. At item level, Rice, Wheat, Wheat Atta, Buffalo Milk, Poultry/Chicken, Cauliflower, Cabbage, Onion, Potato, Tomato, Peas, Chillies dry, Biscuits, Vada, Idli, Dosa, Cooked Meals, Tea cup, Doctor’s fee etc. are responsible for the rise in index. However, this increase was largely checked by Apple, Banana, Fish fresh, Palm Oil, Mustard oil, Cotton seed Oil, Sunflower Oil, Chillies Green, Brinjal, Orange, French Bean, Electricity Domestic etc. putting downward pressure on the index.
At centre level, Ludhiana recorded a maximum increase of 3.6 points. Among others, 4 centres recorded increase between 3 to 3.4 points, 14 centres between 2 to 2.9 points, 29 centres between 1 to 1.9 points and 25 centres between 0.1 to 0.9 points. On the contrary, Doom-Dooma Tinsukia and Haldia recorded a maximum decrease of 1.3 points each. Among others, 2 centers recorded decrease between 1 to 1.2 points, 8 centres between 0.1 to 0.9 points. Rest of three centers index remained stationary.
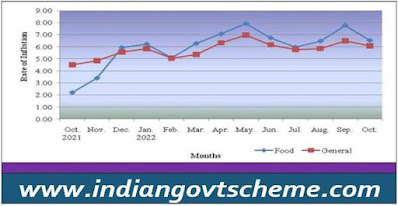
Year-on-year inflation for the month stood at 6.08 per cent compared to 6.49 per cent for the previous month and 4.52 per cent during the corresponding month a year before. Similarly, Food inflation stood at 6.52 per cent against 7.76 per cent of the previous month and 2.20 per cent during the corresponding month a year ago.
Y-o-Y Inflation based on CPI-IW (Food and General)
Inflation based on CPI-IW (Food and General)

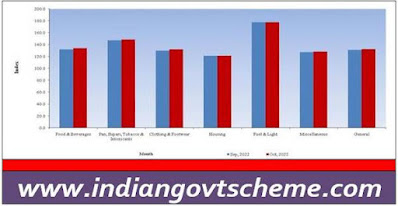
All-India Group-wise CPI-IW for September, 2022 and October, 2022
Sr. No.
Groups
September, 2022
October, 2022

I
Food & Beverages

131.9

133.9

II
Pan, Supari, Tobacco & Intoxicants

147.3

148.5

III
Clothing & Footwear

129.7

131.9

IV
Housing

121.0

121.0

V
Fuel & Light

177.8

177.8

VI
Miscellaneous

127.5

128.4
General Index
131.3
132.5
CPI-IW: Groups Indices

The next issue of CPI-IW for the month of November, 2022 will be released on Friday, 30th December, 2022. The same will also be available on the office website www.labourbureaunew.gov.in.

नोट :- हमारे वेबसाइट www.indiangovtscheme.com पर ऐसी जानकारी रोजाना आती रहती है, तो आप ऐसी ही सरकारी योजनाओं की जानकारी पाने के लिए हमारे वेबसाइट www.indiangovtscheme.com से जुड़े रहे।
*****
लेटेस्‍ट अपडेट के लिए  FacebookTwitterTelegram से  अवश्‍य जुड़ें

Consumer Price Index for Industrial Workers (2016=100) – September, 2022

Consumer Price Index for Industrial Workers (2016=100) – September, 2022

Ministry of Labour & Employment

Consumer Price Index for Industrial Workers (2016=100) – September, 2022

All-India CPI-IW for September, 2022 increased by 1.1 points and stood at 131.3

Posted On: 31 OCT 2022 5:55PM by PIB Delhi

The Labour Bureau, an attached office of the Ministry of Labour & Employment, has been compiling Consumer Price Index for Industrial Workers every month on the basis of retail prices collected from 317 markets spread over 88 industrially important centres in the country. The index is compiled for 88 centres and All-India and is released on the last working day of succeeding month.

The All-India CPI-IW for September, 2022 increased by 1.1 points and stood at 131.3 (one hundred thirty-one point three). On 1-month percentage change, it increased by 0.84 per cent with respect to previous month compared to an increase of 0.24 per cent recorded between corresponding months a year ago.

The maximum upward pressure in current index came from Food & Beverages group contributing 0.68 percentage points to the total change. At item level Rice, Wheat Atta,  Buffalo Milk, Dairy milk, Poultry/Chicken, Carrot, Cauliflower, Green Coriander leaves, Onion, Potato, Tomato, Vada, Idli, Dosa etc. are responsible for the rise in index. However, this increase was largely checked by Fish fresh, Palm Oil, Mustard oil, Sunflower oil, Soyabeen oil, Apple, Asafoetida, Orange, Gourd (Lauki)  etc. putting downward pressure on the index.

At centre level, Bhavnagar recorded a maximum increase of 4.5 points. Among others, 6 centres recorded increase between 3 to 3.9 points, 10 centres between 2 to 2.9 points, 24 centres between 1 to 1.9 points and 30 centres between 0.1 to 0.9 points. On the contrary, Chindwara, Ahmedabad and Shilong recorded a maximum decrease of 0.6 points each. Among others, 8 centers recorded decrease between 0.1 to 0.9 points. Rest of six centers index remained stationary.

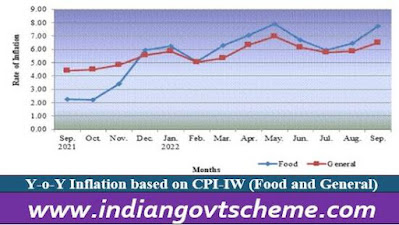
Year-on-year inflation for the month stood at 6.49 per cent compared to 5.85 per cent for the previous month and 4.40 per cent during the corresponding month a year before. Similarly, Food inflation stood at 7.76 per cent against 6.46 per cent of the previous month and 2.26 per cent during the corresponding month a year ago.

Year-on-year inflation for the month stood at 6.49 per cent

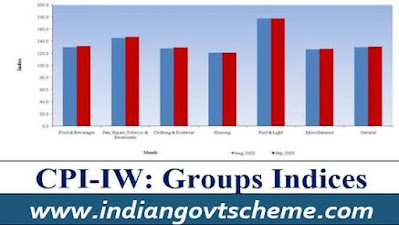
All-India Group-wise CPI-IW for August, 2022 and September, 2022

Sr. No. Groups August, 2022 September, 2022
I Food & Beverages 130.2 131.9
II Pan, Supari, Tobacco & Intoxicants 145.7 147.3
III Clothing & Footwear 128.2 129.7
IV Housing 121.0 121.0
V Fuel & Light 177.4 177.8
VI Miscellaneous 126.6 127.5
General Index 130.2 131.3


CPI-IW: Groups Indices
The next issue of CPI-IW for the month of October, 2022 will be released on Wednesday, 30th November, 2022. It will be available on the office website www.labourbureaunew.gov.in.

नोट :- हमारे वेबसाइट www.indiangovtscheme.com पर ऐसी जानकारी रोजाना आती रहती है, तो आप ऐसी ही सरकारी योजनाओं की जानकारी पाने के लिए हमारे वेबसाइट www.indiangovtscheme.com से जुड़े रहे।
*****

Consumer Price Index for Industrial Workers (2016=100) – August, 2022 उपभोक्ता मूल्य सूचकांक 0.3 अंक बढ़कर 130.2

Consumer Price Index for Industrial Workers (2016=100) – August, 2022 उपभोक्ता मूल्य सूचकांक 0.3 अंक बढ़कर 130.2 

Ministry of Labour & Employment

Consumer Price Index for Industrial Workers (2016=100) – August, 2022

Posted On: 30 SEP 2022 7:04PM by PIB Delhi

The Labour Bureau, an attached office of the M/o Labour & Employment, has been compiling Consumer Price Index for Industrial Workers every month on the basis of retail prices collected from 317 markets spread over 88 industrially important centres in the country. The index is compiled for 88 centres and All-India and is released on the last working day of succeeding month. The index for the month of August, 2022 is being released in this press release.

श्रम ब्यूरो, श्रम एवं रोज़गार मंत्रालय से संबंधित कार्यालय द्वारा हर महीने औद्योगिक श्रमिकों के लिए उपभोक्ता मूल्य सूचकांक का संकलन सम्पूर्ण देश में फैले हुए 88 महत्वपूर्ण औद्योगिक केंद्रों के 317 बाजारों से एकत्रित खुदरा मूल्यों के आधार पर किया जाता है। सूचकांक का संकलन 88 औद्योगिक केंद्रों एवं अखिल भारत के लिए किया जाता है और आगामी महीने के अंतिम कार्यदिवस पर जारी किया जाता है। अगस्त, 2022 के लिए सूचकांक इस प्रेस विज्ञप्ति के माध्यम से जारी किया जा रहा है।

The All-India CPI-IW for August, 2022 increased by 0.3 points and stood at 130.2 (one hundred thirty point two). On 1-month percentage change, it increased by 0.23 per cent with respect to previous month compared to an increase of 0.16 per cent recorded between corresponding months a year ago.

अगस्त, 2022 का अखिल भारत उपभोक्ता मूल्य सूचकांक (औद्योगिक श्रमिक) 0.3 अंक बढ़कर 130.2 (एक सौ तीस दशमलव दो) अंकों के स्तर पर संकलित हुआ। सूचकांक में पिछले माह की तुलना में 0.23 प्रतिशत की वृद्धि रही जबकि एक वर्ष पूर्व इन्हीं दो महीनों के बीच 0.16 प्रतिशत की वृद्धि दर्ज की गई थी।

The maximum upward pressure in current index came from Food & Beverages group contributing 0.19 percentage points to the total change. At item level Rice, Wheat Atta, Arhar/Tur  Dal, Wheat, Mango, Buffalo Milk, Cooked Meal, Telephone Charges mobile etc. are responsible for the rise in index. However, this increase was largely checked by Apple, Tomato, Poultry Chicken, Soyabeen oil, Sunflower Oil, Egg Hen, Electricity Domestic, Petrol for Vehicle etc. putting downward pressure on the index.

सूचकांक में दर्ज वृद्धि में अधिकतम योगदान खाद्य एवं पेय समूह का रहा जिसने कुल बदलाव को 0.19  बिन्दु प्रतिशतता से प्रभावित किया। मदों में चावल, गेंहू आटा, अरहर/तुर दाल, गेंहू, आम, भैंस का दूध, तैयार भोजन, टेलीफोन/मोबाईल प्रभार इत्यादि सूचकांक को बढ़ाने में सहायक रहे। इसके विपरित मुख्यतः सेब, टमाटर, पोल्ट्री चिकन, सोयाबीन का तेल, सूरजमुखी का तेल, मुर्गी के अंडे, विद्धुत प्रभार, पेट्रोल आदि ने सूचकांक में दर्ज वृद्धि को नियंत्रित करने का प्रयास किया।

At centre level, Solapur recorded a maximum increase of 3.9 points followed by Agra with 3.2 points. Among others, 5 centres recorded increase between 2 to 2.9 points, 20 centres between 1 to 1.9 points and 27 centres between 0.1 to 0.9 points. On the contrary, Jamshedpur recorded a maximum decrease of 3.7 points. Among others, 8 centers recorded decrease between 1 to 1.9 points and 24 centres between 0.1 to 0.9 points. Rest one centre index remained stationary.

केंद्र-स्तर पर शोलापूर के सूचकांक में अधिकतम 3.9 अंक की वृद्धि रही जिसके पश्चात अगरा में 3.2 अंक की वृद्धि दर्ज की गई। अन्य 5 केंद्रों में 2 से 2.9 अंक, 20 केंद्रों में 1 से 1.9 अंक और 27 केंद्रों में 0.1 से 0.9 अंक के बीच वृद्धि रही। इसके विपरीत जमशेदपुर में अधिकतम 3.7 अंक की कमी रही| अन्य 8 केंद्रों में 1 से 1.9 अंक और 24 केंद्रों में 0.1 से 0.9 अंक तक की कमी दर्ज की गई | शेष एक केंद्र का सूचकांक स्थिर रहा।

Year-on-year inflation for the month stood at 5.85 per cent compared to 5.78 per cent for the previous month and 4.80 per cent during the corresponding month a year before. Similarly, Food inflation stood at 6.46 per cent against 5.96 per cent of the previous month and 4.83 per cent during the corresponding month a year ago.

अगस्त, 2022 के लिए मुद्रास्फीति दर पिछले महीने के 5.78 प्रतिशत तथा गत वर्ष के इसी माह के 4.80 प्रतिशत की तुलना में 5.85 प्रतिशत रहा। खाद्य-स्फीति दर पिछले माह के 5.96 प्रतिशत एवं एक वर्ष पूर्व इसी माह के 4.83 प्रतिशत की तुलना में 6.46 प्रतिशत रहा।

Y-o-Y Inflation based on CPI-IW (Food and General)

सी.पी.आई.- आई.डब्ल्यू. पर आधारित मुद्रास्फीति दर (खाद्य एवं सामान्य)

Y-o-Y Inflation based on CPI-IW

All-India Group-wise CPI-IW for July, 2022 and August, 2022

अखिल-भारत समूह-वार सूचकांक:  जुलाई, 2022 एवं अगस्त, 2022

Sr. No.

Groups

July, 2022

August, 2022

I

Food & Beverages

129.7

130.2

II

Pan, Supari, Tobacco & Intoxicants

144.4

145.7

III

Clothing & Footwear

127.2

128.2

IV

Housing

121.0

121.0

V

Fuel & Light

178.2

177.4

VI

Miscellaneous

126.1

126.6

General Index

129.9

130.2

CPI-IW: Groups Indices

CPI-IW: Groups Indices
The next issue of CPI-IW for the month of September, 2022 will be released on Monday, 31th October, 2022. The same will also be available on the office website
सूचकांक की आगामी कड़ी सितंबर, 2022 माह के लिए दिन सोमवार 31 अक्टूबर, 2022 को जारी की जाएगी। यह कार्यालय की वेबसाईट www.labourbureaunew.gov.in पर भी उपलब्ध रहेगा।
नोट :- हमारे वेबसाइट www.indiangovtscheme.com पर ऐसी जानकारी रोजाना आती रहती है, तो आप ऐसी ही सरकारी योजनाओं की जानकारी पाने के लिए हमारे वेबसाइट www.indiangovtscheme.com से जुड़े रहे।

*****

Consumer Price Index for Industrial Workers (2016=100) – July, 2022

Consumer Price Index for Industrial Workers (2016=100) – July, 2022

Ministry of Labour & Employment

Consumer Price Index for Industrial Workers (2016=100) – July, 2022

Posted On: 31 AUG 2022 7:37PM by PIB Delhi

The Labour Bureau, an attached office of the M/o Labour & Employment, has been compiling Consumer Price Index for Industrial Workers every month on the basis of retail prices collected from 317 markets spread over 88 industrially important centres in the country. The index is compiled for 88 centres and All-India and is released on the last working day of succeeding month. The index for the month of July, 2022 is being released in this press release.

The All-India CPI-IW for July, 2022 increased by 0.7 points and stood at 129.9 (one hundred twenty nine point nine). On 1-month percentage change, it increased by 0.54 per cent with respect to previous month compared to an increase of 0.90 per cent recorded between corresponding months a year ago.

The maximum upward pressure in current index came from Housing group contributing 0.37 percentage points to the total change. At item level Cooking Gas, Electricity Domestic, Potato, Onion, Gourd, Mango, Banana, Chillies Dry, Cooked Meal, Wheat, Wheat Atta, Arhar Dal, Tur Dal etc. are responsible for the rise in index. However, this increase was largely checked by Tomato, Poultry Chicken, Soyabeen oil, Sunflower Oil, Mustard oil, Palm Oil,  Rice, Apple, Lemon, Radish, Garlic, Drum Stick etc. putting downward pressure on the index.

At centre level, Udham Singh Nagar recorded a maximum increase of 3.8 points followed by Jalpaiguri and Jalandhar with 3.3 and 3.2 points respectively. Among others, 9 centres recorded increase between 2 to 2.9 points, 32 centres between 1 to 1.9 points and 24 centres between 0.1 to 0.9 points. On the contrary, Salem recorded a maximum decrease of 4.1 points. Among others, 2 centers recorded decrease between 2 to 2.9 points, 3 centers between 1 to 1.9 points and 11 centres between 0.1 to 0.9 points. Rest of 3 centres’ indices remained stationary.

Year-on-year inflation for the month stood at 5.78 per cent compared to 6.16 per cent for the previous month and 5.26 per cent during the corresponding month a year before. Similarly, Food inflation stood at 5.96 per cent against 6.73 per cent of the previous month and 4.91 per cent during the corresponding month a year ago.

Y-o-Y Inflation based on CPI-IW (Food and General)

Inflation based on CPI-IW

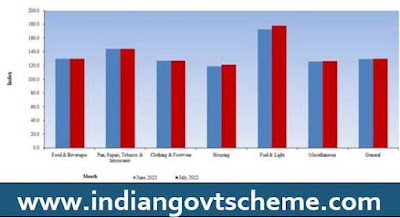
All-India Group-wise CPI-IW for June, 2022and July, 2022

Sr. No. Groups

June, 2022

July, 2022
I Food & Beverages

130.0

129.7

II Pan, Supari, Tobacco & Intoxicants

144.4

144.4

III Clothing & Footwear

127.0

127.2

IV Housing

118.9

121.0

V Fuel & Light

172.8

178.2

VI Miscellaneous

125.9

126.1

General Index

129.2

129.9

CPI-IW: Groups Indices

CPI-IW: Groups Indices
The next issue of CPI-IW for the month of August, 2022 will be released on Friday, 30th September, 2022. The same will also be available on the office website www.labourbureaunew.gov.in.

नोट :- हमारे वेबसाइट www.indiangovtscheme.com पर ऐसी जानकारी रोजाना आती रहती है, तो आप ऐसी ही सरकारी योजनाओं की जानकारी पाने के लिए हमारे वेबसाइट www.indiangovtscheme.com से जुड़े रहे।
*****

Consumer Price Index for Industrial Workers (2016=100) – June, 2022

Consumer Price Index for Industrial Workers (2016=100) – June, 2022

Ministry of Labour & Employment

Consumer Price Index for Industrial Workers (2016=100) – June, 2022

प्रविष्टि तिथि: 30 JUL 2022 10:41AM by PIB Delhi

The Labour Bureau, an attached office of the M/o Labour & Employment, has been compiling Consumer Price Index for Industrial Workers every month on the basis of retail prices collected from 317 markets spread over 88 industrially important centres in the country. The index is compiled for 88 centres and All-India and is released on the last working day of succeeding month. The index for the month of June, 2022 is being released in this press release.

The All-India CPI-IW for June, 2022 increased by 0.2 points and stood at 129.2 (one hundred twenty nine point two). On 1-month percentage change, it increased by 0.16 per cent with respect to previous month compared to an increase of 0.91 per cent recorded between corresponding months a year ago.

The maximum upward pressure in current index came from Food & Beverages group contributing 0.20 percentage points to the total change. At item level Potato, Onion, Tomato, Cabbage, Apple, Banana, Coriander, Chilly Dry,  Fish Fresh, Poultry Chicken, Vada, Idli Dosa, Cooked Meal, Cooking Gas, kerosene Oil, Electricity Domestic etc. are responsible for the rise in index. However, this increase was largely checked by Petrol for Vehicle, Rice, Mango, Chilli Green, Lemon, Lady Finger, Parwal, Pineapple, Soyabeen Oil, Sunflower Oil etc. putting downward pressure on the index.

At centre level, Puducherry recorded a maximum increase of 2.6 points followed by Amritsar and Tripura with 2.2 and 2.0 points respectively. Among others, 15 centres recorded increase between 1 to 1.9 points, 33 centres between 0.1 to 0.9 points. On the contrary, Sangrur recorded a maximum decrease of 2.4 points. Among others, 5 centers recorded decrease between 1 to 1.9 points, 25 centres between 0.1 to 0.9 points. Rest of 6 centres’ indices remained stationary.

Year-on-year inflation for the month stood at 6.16 per cent compared to 6.97 per cent for the previous month and 5.57 per cent during the corresponding month a year before. Similarly, Food inflation stood at 6.73 per cent against 7.92 per cent of the previous month and 5.61 per cent during the corresponding month a year ago.

All-India Group-wise CPI-IW for May, 2022

All-India Group-wise CPI-IW for May, 2022 and June, 2022

Sr. No. Groups May, 2022 June, 2022
I Food & Beverages 129.5 130.0
II Pan, Supari, Tobacco & Intoxicants 144.7 144.4
III Clothing & Footwear 126.5 127.0
IV Housing 118.9 118.9
V Fuel & Light 169.7 172.8
VI Miscellaneous 126.4 125.9
General Index 129.0 129.2
CPI-IW: Groups Indices

The next issue of CPI-IW for the month of July, 2022 will be released on Wednesday, 31st August, 2022. The same will also be available on the office website www.labourbureaunew.gov.in.

नोट :- हमारे वेबसाइट www.indiangovtscheme.com पर ऐसी जानकारी रोजाना आती रहती है, तो आप ऐसी ही सरकारी योजनाओं की जानकारी पाने के लिए हमारे वेबसाइट www.indiangovtscheme.com से जुड़े रहे।

*****

Consumer Price Index for Industrial Workers (2016=100) – May, 2022 Increased by 1.3 Point

Consumer Price Index for Industrial Workers (2016=100) – May, 2022 Increased by 1.3 Point

Ministry of Labour & Employment

Consumer Price Index for Industrial Workers (2016=100) – May, 2022

प्रविष्टि तिथि: 30 JUN 2022 7:56PM by PIB Delhi

The Labour Bureau, an attached office of the M/o Labour & Employment, has been compiling Consumer Price Index for Industrial Workers every month on the basis of retail prices collected from 317 markets spread over 88 industrially important centres in the country. The index is compiled for 88 centres and All-India and is released on the last working day of succeeding month. The index for the month of May, 2022 is being released in this press release.

The All-India CPI-IW for May, 2022 increased by 1.3 points and stood at 129.0 (one hundred twenty nine points). On 1-month percentage change, it increased by 1.02 per cent with respect to previous month compared to an increase of 0.42 per cent recorded between corresponding months a year ago.

The maximum upward pressure in current index came from Food & Beverages group contributing 0.79 percentage points to the total change. At item level Tomato, Potato,  Soya been Oil, Sunflower Oil, Buffalo Milk, Fish Fresh, Poultry Chicken, Cooked Meal,  Cooking Gas, kerosene Oil, Bus Fare, Allopathic Medicine, Telephone Charges etc. are responsible for the rise in index. However, this increase was largely checked by Onion, Bitter Guard, Lady Finger, Chilli Green, Lemon, Mango, Water Melon, Pan Leaf, Petrol for Vehicles etc. putting downward pressure on the index.

At centre level, Coimbatore recorded a maximum increase of 5.2 points followed by Salem and Jalandhar with 4.8 and 4.2 points respectively. Among others, 6 centres recorded increase between 3 to 3.9 points, 19 centres between 2 to 2.9 points, 22 centres between 1 to 1.9 points and 24 centres between 0.1 to 0.9 points. On the contrary, Yamunanagar recorded a maximum decrease of 1.5 points followed by Delhi with 1.2 points. Among others, 9 centers recorded decrease between 0.1 to 0.9 points. Rest of 3 centres’ indices remained stationary.

Year-on-year inflation for the month stood at 6.97 per cent compared to 6.33 per cent for the previous month and 5.25 per cent during the corresponding month a year before. Similarly, Food inflation stood at 7.92 per cent against 7.05 per cent of the previous month and 5.26 per cent during the corresponding month a year ago.

Y-o-Y Inflation based on CPI-IW (Food and General)

Y-o-Y Inflation based on CPI-IW (Food and General)
All-India Group-wise CPI-IW for April, 2022 and May, 2022
Sr. No. Groups April, 2022 May, 2022
I Food & Beverages 127.5 129.5
II Pan, Supari, Tobacco & Intoxicants 144.4 144.7
III Clothing & Footwear 125.6 126.5
IV Housing 118.9 118.9
V Fuel & Light 164.9 169.7
VI Miscellaneous 125.8 126.4
General Index 127.7 129.0
CPI-IW: Groups Indices
The next issue of CPI-IW for the month of June, 2022 will be released on Friday, 29th July, 2022. The same will also be available on the office website www.labourbureaunew.gov.in.

नोट :- हमारे वेबसाइट www.indiangovtscheme.com पर ऐसी जानकारी रोजाना आती रहती है, तो आप ऐसी ही सरकारी योजनाओं की जानकारी पाने के लिए हमारे वेबसाइट www.indiangovtscheme.com से जुड़े रहे।

*****

Consumer Price Index for Industrial Workers (2016=100) – January, 2022

The Labour Bureau, an attached office of the M/o Labour & Employment, has been compiling Consumer Price Index for Industrial Workers every month on the basis of retail prices
Ministry of Labour & Employment

Consumer Price Index for Industrial Workers (2016=100) – January, 2022

Posted On: 28 FEB 2022 6:29PM by PIB Delhi

The Labour Bureau, an attached office of the M/o Labour & Employment, has been compiling Consumer Price Index for Industrial Workers every month on the basis of retail prices collected from 317 markets spread over 88 industrially important centres in the country. The index is compiled for 88 centres and All-India and is released on the last working day of succeeding month. The index for the month of January, 2022 is being released in this press release.

The All-India CPI-IW for January, 2022 decreased by 0.3 points and stood at 125.1 (one hundred twenty five and point one). On 1-month percentage change, it decreased by 0.24 per cent with respect to previous month compared to decrease of 0.51 per cent recorded between corresponding months a year ago.

The maximum downward pressure in current index came from Food & Beverages group contributing 0.82 percentage points to the total change. At item level, Fish fresh, Mustard Oil, Apple, Carrot, French-been, Garlic, Brinjal, Cauliflower, Lady’s finger, Onion, Peas, Potato, Radish, Tomato, etc. are responsible for the fall in index. However, this decrease was checked by House rent, Rice, Wheat, Buffalo-Milk, Goat meat/Mutton, Orange, Beetroot, Chilli dry, Cooked Meals,  etc. putting upward pressure on the index.

At centre level, Puducherry recorded a maximum decrease of 7.3 points. Among others, 5 centres recorded decrease between 2 to 2.9 points, 13 centres between 1 to 1.9 points and 33 centres between 0.1 to 0.9 points. On the contrary, Ludhiana recorded a maximum increase of 2.3 points. Among others, 6 centres recorded increase between 1 to 1.9 points and 26 centres between 0.1 to 0.9 points. Rest of 3 centres’ indices remained stationary.

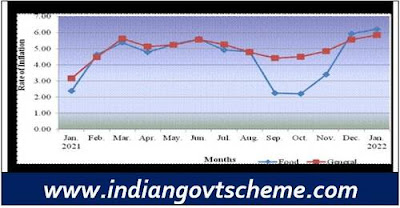
Year-on-year inflation for the month stood at 5.84 per cent compared to 5.56 per cent for the previous month and 3.15 per cent during the corresponding month a year before. Similarly, Food inflation stood at 6.22 per cent against 5.93 per cent of the previous month and 2.38 per cent during the corresponding month a year ago.

Y-o-Y Inflation based on CPI-IW (Food and General)

Inflation based on CPI-IW

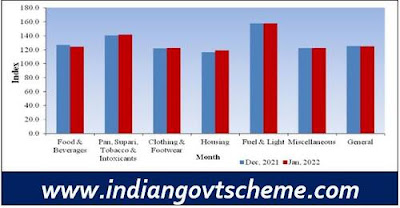
All-India Group-wise CPI-IW for December, 2021 and January, 2022

Sr. No. Groups

December, 2021

January, 2022
I Food & Beverages

126.8

124.7

II Pan, Supari, Tobacco & Intoxicants

140.8

141.5

III Clothing & Footwear

122.0

122.4

IV Housing

116.8

118.9

V Fuel & Light

157.7

158.0

VI Miscellaneous

122.5

122.7

General Index

125.4

125.1

CPI-IW: Groups Indices

CPI-IW Groups Indices
The next issue of CPI-IW for the month of February, 2022 will be released on Thursday, 31st March, 2022. The same will also be available on the office website.

Click here For “Consumer Price Index for Industrial Workers on base 2016=100”,

नोट :- हमारे वेबसाइट www.indiangovtscheme.com पर ऐसी जानकारी रोजाना आती रहती है, तो आप ऐसी ही सरकारी योजनाओं की जानकारी पाने के लिए हमारे वेबसाइट www.indiangovtscheme.com से जुड़े रहे।
*****

Consumer Price Index for Industrial Workers October 2021

Consumer Price Index for Industrial Workers October 2021 every month on the basis of retail prices collected from 317 markets spread over 88 industrially important centres in the country

Ministry of Labour & Employment

Consumer Price Index for Industrial Workers (2016=100) – October, 2021

Posted On: 30 NOV 2021 5:19PM by PIB Delhi

The Labour Bureau, an attached office of the M/o Labour & Employment, has been compiling Consumer Price Index for Industrial Workers every month on the basis of retail prices collected from 317 markets spread over 88 industrially important centres in the country. The index is compiled for 88 centres and All-India and is released on the last working day of succeeding month. The index for the month of October, 2021 is being released in this press release.

The All-India CPI-IW for October, 2021 increased by 1.6 points and stood at 124.9 (one hundred twenty four and point nine). On 1-month percentage change, it increased by 1.30 per cent with respect to previous month compared to an increase of 1.19 per cent recorded between corresponding months a year ago.

The maximum upward pressure in current index came from Food & Beverages group contributing 1.31 percentage points to the total change. At item level, Mustard Oil, Tomato, Onion, Brinjal, Cabbage, Cauliflower, Lady’s Finger, Peas, Potato, Cooking Gas, Petrol for Vehicle, etc. are responsible for the rise in index. However, this increase was largely checked by Moong Dal, Fish Fresh, Apple, Grapes, Orange, Ginger, etc. putting downward pressure on the index.

Shri D.P.S.Negi, Principal Labour & Employment Advisor & Chief Labour Commissioner(C) informed that at centre level, Udham Singh Nagar recorded a maximum increase of 5.8 points followed by Ramgarh and Biswanath-Chariali with 4.6 points and 4.0 points respectively. Among others, 5 centres observed an increase between 3 to 3.9 points, 22 centres between 2 to 2.9 points, 39 centres between 1 to 1.9 points and 16 centres between 0.1 to 0.9 points. On the contrary, Ludhiana recorded a maximum decrease of 0.3 points followed by Idukki and Darjeeling with 0.2 points each.

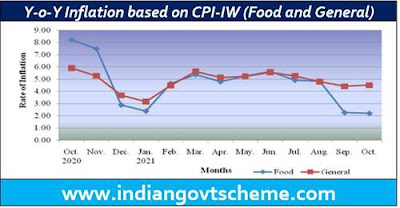
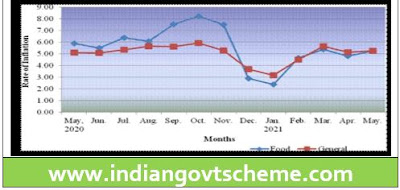
Year-on-year inflation for the month stood at 4.50 per cent compared to 4.41 per cent for the previous month and 5.91 per cent during the corresponding month a year before. Similarly, Food inflation stood at 2.20 per cent against 2.26 per cent of the previous month and 8.21 per cent during the corresponding month a year ago.

Inflation based on CPI-IW

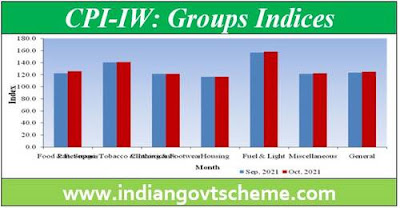
All-India Group-wise CPI-IW for September and October, 2021

Sr. No. Groups

September, 2021

October, 2021

I Food & Beverages

122.4

125.7

II Pan, Supari, Tobacco & Intoxicants

140.8

141.1

III Clothing & Footwear

121.5

121.5

IV Housing

116.8

116.8

V Fuel & Light

156.9

158.3

VI Miscellaneous

121.7

122.3

General Index

123.3

124.9

CPI-IW: Groups Indices

The next issue of CPI-IW for the month of November, 2021 will be released on Friday, 31st December, 2021.

नोट :- हमारे वेबसाइट www.indiangovtscheme.com पर ऐसी जानकारी रोजाना आती रहती है, तो आप ऐसी ही सरकारी योजनाओं की जानकारी पाने के लिए हमारे वेबसाइट www.indiangovtscheme.com से जुड़े रहे।
*****

Consumer Price Index for Industrial Workers (2016=100) – August, 2021

Consumer Price Index for Industrial Workers (2016=100) – August, 2021

Ministry of Labour & Employment

Consumer Price Index for Industrial Workers (2016=100) – August, 2021

Posted On: 30 SEP 2021 8:48PM by PIB Delhi

The All-India CPI-IW for August, 2021increased by 0.1 point and stood at 123.0 (one hundred twenty three). On 1-month percentage change, it increased by 0.16 per cent with respect to previous month compared to an increase of 0.60 per cent recorded between corresponding months a year ago.

Labour Bureau, an attached office of the Ministry of Labour & Employment, has been compiling Consumer Price Index for Industrial Workers every month on the basis ofretail prices collected from 317 markets spread over 88 industrially important centres in the country. The index is compiled for 88 centres and All-India and is released on the last working day of succeeding month. The index for the month of August, 2021 is being released in this press release.

The maximum upward pressure in current index came from Miscellaneous group contributing 0.08 percentage points to the total change. At item level, Cow Milk, Dairy Milk, Mustard Oil, Palm Oil, Soyabean Oil, Almond, Sugar-white, Tea Leaf, Cooking Gas, Hospital/Nursing Home Charges, Petrol for Vehicle, Toilet Soap, etc. are responsible for the rise in index. However, this increase was largelychecked by Rice, Eggs (Hen), Fish Fresh, Poultry/Chicken, Apple, Banana, Guava, Mausami, Bitter Gourd, Cucumber, Drum Stick, French Beans, Lady’s Finger, Onion, Potato, etc. putting downward pressure on the index.

At centre level, Ludhiana recorded maximum increase of 3.5points followed by Jalpai guri, Guwahati, Jalandhar and Munger-Jamalpur with 2.9 points, 2.6 points, 2.1 points and 2.0 points respectively. Among others,11 centres observed an increase between 1 to 1.9 points and 33 centres between 0.1 to 0.9 points. On the contrary, Coonoor recorded a maximum decrease of 5.5 points followed by Tirunelveli with 2.2 points. Among others, 5 centres observed a decline between 1 to 1.9 points and 26 centres between 0.1 to 0.9 points. Rest of 6 centres remained stationary.

Year-on-year inflation for the month stood at 4.79 per cent compared to 5.27per cent for the previous month and 5.63 per cent during the corresponding month a year before. Similarly, Food inflation stood at 4.83per cent against 4.91per cent of the previous month and 6.06per cent during the corresponding month a year ago.

Shri D.PS. Negi, Principal Advisor, Ministry of Labour & Employment said that All-India Consumer Price Index for Industrial Workers (2016=100) for August, 2021 increased to 123.0 points compared to 122.8 points for July, 2021.

Shri Negi further said that the increase observed in index is mainly due to items like Cow Milk, Dairy Milk, Mustard Oil, Palm Oil, Soyabean Oil, Almond, Sugar-white, Tea Leaf, Cooking Gas, Hospital/Nursing Home Charges, Petrol for Vehicle, Toilet Soap, etc. which experienced an increase in prices.  General inflation for August, 2021 went down to 4.79 per cent compared to 5.27 per cent of previous month. Food inflation also moderated to 4.83 per cent from 4.91 per cent in the previous month.

Y-o-Y Inflation based on CPI-IW (Food and General)

Inflation based on CPI-IW

All-India Group-wise CPI-IW for JulyandAugust,2021

Sr. No.

Groups

July, 2021

August, 2021

I

Food & Beverages

122.4

122.3

II

Pan, Supari, Tobacco & Intoxicants

138.9

139.1

III

Clothing & Footwear

120.8

121.0

IV

Housing

116.8

116.8

V

Fuel & Light

152.0

153.1

VI

Miscellaneous

121.1

121.3

General Index

122.8

123.0


CPI-IW: Groups Indices

CPI-IW: Groups Indices

The next issue of CPI-IW for the month of September, 2021 will be released on Friday,29th October, 2021

Source: PIB

नोट :- हमारे वेबसाइट www.indiangovtscheme.com पर ऐसी जानकारी रोजाना आती रहती है, तो आप ऐसी ही सरकारी योजनाओं की जानकारी पाने के लिए हमारे वेबसाइट www.indiangovtscheme.com से जुड़े रहे।

*****

Consumer Price Index for Industrial Workers (2016=100) – May, 2021 औद्योगिक श्रमिकों के लिए उपभोक्ता मूल्य सूचकांक (2016=100)- मई, 2021

Consumer Price Index for Industrial Workers (2016=100) – May, 2021 औद्योगिक श्रमिकों के लिए उपभोक्ता मूल्य सूचकांक (2016=100)- मई, 2021

 Ministry of Labour & Employment

श्रम और रोजगार मंत्रालय

Consumer Price Index for Industrial Workers (2016=100) – May, 2021

औद्योगिक श्रमिकों के लिए उपभोक्ता मूल्य सूचकांक (2016=100)- मई, 2021

Posted On: 30 JUN 2021 5:13PM by PIB Delhi

Key Points मुख्य बिंदु

All-India Consumer Price Index for Industrial Workers (2016=100) for May, 2021 increased to 120.6 points compared to 120.1 points for April 2021.

औद्योगिक श्रमिकों के लिए अखिल भारतीय उपभोक्ता मूल्य सूचकांक (2016=100) मई, 2021, बढ़कर 120.6 अंक हो गया है जबकि यह अप्रैल 2021 में 120.1 अंक था।

The increase observed in index is mainly due to Food & Fuel items like Rice, Arhar Dal, Masur Dal, Fish Fresh, Goat Meat, Eggs-Hen, Edible Oil, Apple, Banana, Jamun, Papaya, Potato, Tomato, Brinjal, Cabbage, French Bean, Garlic, Onion, Sugar White, Tea-leaf, Cooking Gas, Kerosene Oil, Petrol, etc. which experienced an increase in prices.

सूचकांक में दर्ज की गई वृद्धि मुख्य रूप से खाद्य और ईंधन वस्तुओं, जैसे अचावल, अरहर दाल, मसूर दाल, ताजा मछली, बकरी का मांस, अंडे-मुर्गी, खाद्य तेल, सेब, केला, जामुन, पपीता, आलू, टमाटर, बैंगन, गोभी, फ्रेंच बीन, लहसुन, प्याज, सफेद चीनी, चाय पत्ती , रसोई गैस, मिट्टी का तेल, पेट्रोल, आदि जैसी वस्तुओं की कीमतों में हुई बढ़ोत्तरी के कारण हुई है।

Inflation for May, 2021 went up to 5.24 per cent compared to 5.14 per cent of previous month. Similarly, Food inflation also increased to 5.26 per cent from 4.78 per cent in the previous month.

मई, 2021 में मुद्रास्फीति दर, पिछले महीने के 5.14 प्रतिशत की तुलना में बढ़कर 5.24 प्रतिशत हो गई है। इसी तरह खाद्य मुद्रास्फीति भी पिछले महीने के 4.78 प्रतिशत की तुलना में बढ़कर 5.26 प्रतिशत हो गई है।

The All-India CPI-IW for May, 2021 increased by 0.5 points and stood at 120.6 (one hundred twenty and point six). On 1-month percentage change, it increased by 0.42 per cent with respect to previous month compared to an increase of 0.30 per cent recorded between corresponding months a year ago.

मई, 2021 के लिए, अखिल भारतीय सीपीआई-आईडब्ल्यू में 0.5 अंकों की वृद्धि हुई है और यह 120.6 (एक सौ बीस दशमलव छ:) पर पहुंच गई है। एक महीने के प्रतिशत बदलाव के आधार पर, इसमें पिछले महीने की तुलना में 0.42 प्रतिशत की वृद्धि हुई है, जबकि एक वर्ष पहले इसी महीने इसमें 0.30 प्रतिशत की वृद्धि दर्ज की गई थी।
The maximum upward pressure in current index came from Food & Beverages group contributing 0.35 percentage points to the total change. At item level, Rice, Arhar Dal, Masur Dal, Fish Fresh, Goat Meat, Eggs-Hen, Edible Oil, Apple, Banana, Jamun, Papaya, Potato, Tomato, Brinjal, Cabbage, French Bean, Garlic, Onion, Sugar White, Tea-leaf, Cooking Gas, Kerosene Oil, Mobile Telephone Charges, Petrol, etc. are responsible for the rise in index. However, this increase was mostly checked by Leechi, Mango, Water Melon, Bitter Gourd, Lady’s Finger, Lemon, Parwal, Torai, Tamarind, etc. putting downward pressure on the index.
वर्तमान सूचकांक में अधिकतम वृद्धि का कारण खाद्य और पेय पदार्थ समूह रहा है, जिसने कुल परिवर्तन को 0.35 प्रतिशत अंक से प्रभावित किया है। मदों के स्तर पर, चावल, अरहर दाल, मसूर दाल, ताजा मछली, बकरी का मांस, अंडे-मुर्गी, खाद्य तेल, सेब, केला, जामुन, पपीता, आलू, टमाटर, बैंगन, गोभी, फ्रेंच बीन, लहसुन, प्याज, सफेद चीनी, चाय पत्ती , रसोई गैस, मिट्टी का तेल, मोबाइल टेलीफोन शुल्क, पेट्रोल, आदि आदि सूचकांक में बढ़ोत्तरी के लिए जिम्मेदार हैं। हालांकि, इस वृद्धि को लीची, आम, तरबूज, करेला, भिंडी, नींबू, परवल, तोरई, इमली आदि द्वारा नियंत्रित किया गया है जिससे सूचकांक में कमी लाने का दबाव पड़ा।

At centre level, Coonoor recorded maximum increase of 4.1 points followed by Udham Singh Nagar with 3.6 points. Among others, 4 centres observed an increase between 2 to 2.9 points, 18 centres between 1 to 1.9 points and 41 centres between 0.1 to 0.9 points. On the contrary, Bhilwara recorded a maximum decrease of 1.2 points followed by Amritsar with 1 point. Among others, 17 centres observed a decline between 0.1 to 0.9 points. Rest of 4 centres remained stationary.

केंद्रीय स्तर परकुन्नूर में अधिकतम 4.1 अंकों की वृद्धि दर्ज की गईजिसके बाद ऊधम सिंह नगर 3.6 अंकों के साथ आगे रहे। अन्य में4 केंद्रों में 2 से 2.9 अंकों के बीच18 केंद्रों में 1 से 1.9 अंक के बीच और 41 केंद्रों में 0 से 0.9 अंक के बीच वृद्धि दर्ज की गई। इसके विपरितभीलवाड़ा में अधिकतम 1.2 अंकों और अमृतसर में 1 अंक की कमी दर्ज की गई। अन्य में17 केंद्रों में 0.1 से 0.9  अंकों के बीच गिरावट दर्ज की गई। शेष 4 केंद्र स्थिर रहे।

Year-on-year inflation for the month stood at 5.24 per cent compared to 5.14 per cent for the previous month and 5.10 per cent during the corresponding month an year before. Similarly, Food inflation stood at 5.26 per cent against 4.78 per cent of the previous month and 5.88 per cent during the corresponding month an year ago.

इस महीने की वर्ष-दर-वर्ष महंगाई दर 5.24 फीसदी रही जबकि पिछले महीने यह 5.14 फीसदी और पिछले वर्ष इसी महीने के दौरान 5.10 फीसदी रही थी। इसी प्रकार, खाद्य मुद्रास्फीति 5.26 प्रतिशत रही जबकि पिछले महीने यह 4.78 प्रतिशत और पिछले वर्ष इसी महीने के दौरान 5.88 प्रतिशत रही थी।

Y-o-Y Inflation based on CPI-IW (Food and General)
सीपीआई-आईडब्ल्यू (खाद्य और सामान्य) पर आधारित वर्ष-दर-वर्ष मुद्रास्फीति

Food and General

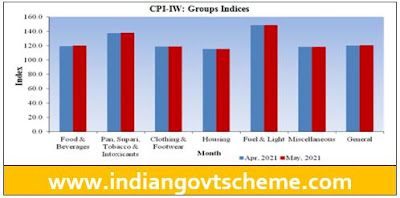
All-India Group-wise CPI-IW for April and May, 2021
अखिल भारतीय समूह-वार सीपीआई-आईडब्ल्यू: अप्रैल और मई, 2021

Sr. No. Groups Apr, 2021 May, 2021
I Food & Beverages 119.1 120.0
II Pan, Supari, Tobacco & Intoxicants 137.3 137.8
III Clothing & Footwear 119.0 119.0
IV Housing 115.2 115.2
V Fuel & Light 148.7 148.9
VI Miscellaneous 118.3 118.6
General Index 120.1 120.6

CPI-IW: Groups Indices सीपीआई-आईडब्ल्यू: समूह सूचकांक

CPI-IW: Groups Indices

The next issue of CPI-IW for the month of June, 2021 will be released on Friday 30th July, 2021. The same will also be available on the office website www.labourbureaunew.gov.in.

जून, 2021 के लिए सीपीआई-आईडब्ल्यू का अगला अंक शुक्रवार 30 जुलाई, 2021 को जारी किया जाएगा, जो कि कार्यालय की वेबसाइट www.labourbureaunew.gov.in  पर भी उपलब्ध होगा।

While releasing the index, Minister of Labour & Employment Shri Santosh Gangwar said that the rise in index will result into increased wages of working  Class population by way of increase in dearness allowance payable to them.

नवीनतम सूचकांक के संदर्भ में बोलते हुए, श्रम एवं रोजगार राज्य मंत्री (स्वतंत्र प्रभार), श्री संतोष गंगवार ने कहा, “सूचकांक में वृद्धि के परिणामस्वरूप श्रमिक वर्ग के वेतन में वृद्धि होगी, जिसके कारण उनके देय महंगाई भत्ते में भी बढ़ोत्तरी होगी।”

Shri Gangwar also said that Increase in wages will provide respite to working class families who have witnessed many hardships during the Lockdown period due to COVID.   Shri DPS Negi Director General, Labour Bureau said that the rise in Index during May, 2021 is in line with all other price indices compiled and released by different agencies in the country and Marginal increase in annual inflation has, however, been observed during the month due to increase in prices of Food and Fuel items which is also in line with other price indices.

श्री गंगवार ने यह भी कहा कि मजदूरी में वृद्धि से उन मजदूर वर्ग के परिवारों को राहत मिलेगी, जिन्होंने कोविड के कारण लॉकडाउन अवधि के दौरान कई कठिनाइयों का सामना किया है। श्रम ब्यूरो के महानिदेशक श्री डीपीएस नेगी ने कहा कि मई, 2021 के दौरान सूचकांक में वृद्धि देश में विभिन्न एजेंसियों द्वारा संकलित और जारी किए गए अन्य सभी मूल्य सूचकांकों के अनुरूप है और वार्षिक मुद्रास्फीति में मामूली वृद्धि देखी गई है।
The Labour Bureau, an attached office of the M/o Labour & Employment, has been compiling Consumer Price Index for Industrial Workers every month on the basis of retail prices collected from 317 markets spread over 88 industrially important centres in the country. The index is compiled for 88 centres and All-India and is released on the last working day of succeeding month.
श्रम एवं रोज़गार मंत्रालय के अंतर्गत श्रम ब्यूरो द्वारा प्रत्येक महीने औद्योगिक श्रमिकों के लिए उपभोक्ता मूल्य सूचकांक का संकलन सम्पूर्ण देश में फैले हुए 88 महत्वपूर्ण औद्योगिक केंद्रों के 317 बाजारों से एकत्रित खुदरा मूल्यों के आधार पर किया जाता है। सूचकांक का संकलन 88 औद्योगिक केंद्रों एवं अखिल भारत के लिए किया जाता है और आगामी महीने के अंतिम कार्य-दिवस पर जारी किया जाता है।

Source: PIB

नोट :- हमारे वेबसाइट www.indiangovtscheme.com पर ऐसी जानकारी रोजाना आती रहती है, तो आप ऐसी ही सरकारी योजनाओं की जानकारी पाने के लिए हमारे वेबसाइट www.indiangovtscheme.com से जुड़े रहे।

*****

Consumer Price Index for Industrial Workers (2016=100) – April, 2021

Consumer Price Index for Industrial Workers (2016=100) – April, 2021

Ministry of Labour & Employment

Consumer Price Index for Industrial Workers (2016=100) – April, 2021

Posted On: 31 MAY 2021 3:36PM by PIB Delhi

Key Points

All-India Consumer Price Index for Industrial Workers (2016=100) for April, 2021 increased to 120.1 points compared to 119.6 points for March, 2021.

The increase observed in index is mainly due to items like Arhar Dal, Masur Dal, Fish Fresh, Goat Meat, Poultry Chicken, Eggs-Hen, Edible Oils, Apple, Banana, Grapes, Leechi, Orange, Papaya, Tea Leaf, Tea Hot-drink, Barber/Beautician Charges, Flowers/Flower Garlands, Doctor’s Fee, Rail Fare, Servicing Charges of Motor Cycle, Cable Charges, etc. which experienced an increase in prices.

Inflation for April, 2021 went down to 5.14 per cent compared to 5.64 per cent of previous month. Food inflation also declined to 4.78 per cent from 5.36 per cent in the previous month.

The All-India CPI-IW for April, 2021 increased by 0.5 points and stood at 120.1 (one hundred twenty and point one). On 1-month percentage change, it increased by 0.42 per cent with respect to previous month compared to an increase of 0.92 per cent recorded between corresponding months a year ago.

The maximum upward pressure in current index came from Food & Beverages group contributing 0.43 percentage points to the total change. At item level, Arhar Dal, Masur Dal, Fish Fresh, Goat Meat, Poultry Chicken, Eggs-Hen, Edible Oils, Apple, Banana, Grapes, Leechi, Orange, Papaya, Tea Leaf, Tea Hot-drink, Barber/Beautician Charges, Flowers/Flower Garlands, Doctor’s Fee, Rail Fare, Servicing Charges of Motor Cycle, Cable Charges, etc. are responsible for the rise in index. However, this increase was largely checked by Rice, Onion, Bitter Gourd, Drum Stick, Lady Finger, Parval, Cooking Gas, Petrol, etc. putting downward pressure on the index.

At centre level, Jabalpur recorded maximum increase of 3.6 points followed by Raipur and Bhavnagar with 3.2 and 3.1 points respectively. Among others, 6 centres observed an increase between 2 to 2.9 points, 11 centres between 1 to 1.9 points and 49 centres between 0 to 0.9 points. On the contrary, Coonoor recorded a maximum decrease of 2.3 points. Among others, 3 centres observed a decline between 1 to 1.9 points and remaining 15 centres between 0 to 0.9 points.

Year-on-year inflation for the month stood at 5.14 per cent compared to 5.64 per cent for the previous month and 5.45 per cent during the corresponding month of the previous year. Similarly, Food inflation stood at 4.78 per cent against 5.36 per cent of the previous month and 6.56 per cent during the corresponding month a year ago.

Y-o-Y Inflation based on CPI-IW

All-India Group-wise CPI-IW for March and April, 2021

Sr. No.

Groups

March, 2021

April, 2021

I

Food & Beverages

118.0

119.1

II

Pan, Supari, Tobacco & Intoxicants

136.5

137.3

III

Clothing & Footwear

118.7

119.0

IV

Housing

115.2

115.2

V

Fuel & Light

149.2

148.7

VI

Miscellaneous

118.1

118.3

General Index

119.6

120.1


CPI-IW: Groups Indices

The next issue of CPI-IW for the month of May, 2021 will be released on Wednesday 30th June, 2021. The same will also be available on the office website www.labourbureaunew.gov.in.
Speaking about the latest index, Minister of State (I/C) for Labour and Employment Shri Santosh Gangwar said “the rise in index will result into increased wages of working class population by way of increase in dearness allowance payable to them.”

Further he added that “Decline in inflation during April, 2021 is a sign of respite for consumers which is mainly due to lower retail prices of vegetables.”

Director General of Labour Bureau Shri DPS Negi said that “the rise in Index during April, 2021 is in line with all other price indices compiled and released & Decline in inflation during the month has been observed across all retail price indices released by other Government agencies.”

The Labour Bureau, an attached office of the M/o Labour & Employment, has been compiling Consumer Price Index for Industrial Workers every month on the basis of retail prices collected from 317 markets spread over 88 industrially important centres in the country. The index is compiled for 88 centres and All-India and is released on the last working day of succeeding month.

Source: PIB

नोट :- हमारे वेबसाइट www.indiangovtscheme.com पर ऐसी जानकारी रोजाना आती रहती है, तो आप ऐसी ही सरकारी योजनाओं की जानकारी पाने के लिए हमारे वेबसाइट www.indiangovtscheme.com से जुड़े रहे। 
*****

Consumer Price Index for Industrial Workers December, 2020

Ministry of Labour & Employment

Consumer Price Index for Industrial Workers (2016=100) – December, 2020

Key points

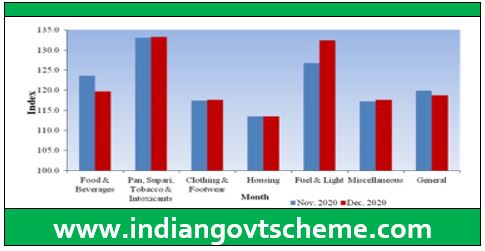
All-India CPI for Industrial Workers (2016=100) for December, 2020 decreased to 118.8 points compared to 119.9 points for November, 2020.

In percentage terms, it went down by 0.92% w.r.t. previous month mainly due to Food group items having a share of 39.17% in the total weight which recorded a fall of 3.16% between these two months. During the period, decrease in prices of food items viz. Rice, Poultry (Chicken), Orange, Brinjal, Cabbage, Cauliflower, Carrot, Chillies Green, Ginger, Onion, Peas, Potato, Tomato, etc.  had greater impact.

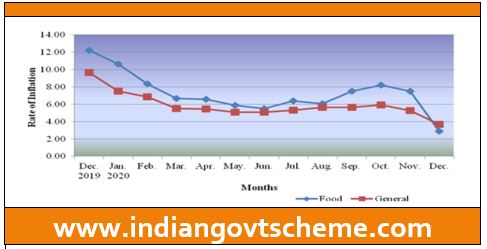
Year-on-year inflation based on all-items stood at 3.67 per cent for December, 2020 as compared to 5.27 per cent for the previous month and 9.63 per cent during the corresponding month of the previous year. Similarly, Food inflation stood at 2.89 per cent against 7.48 per cent of the previous month and 12.22 per cent during the corresponding month a year ago.

The All-India CPI-IW for December, 2020 decreased by 1.1 points and stood at 118.8 (one hundred eighteen and point eight). On 1-month percentage change, it decreased by (-) 0.92per cent between November and December, 2020compared to (+) 0.61 per cent increase between corresponding months of previous year.

The maximum downward pressure in current index came from Food & Beverages group contributing (-) 1.53 percentage points to the total change. At item level, Rice, Poultry (Chicken), Orange, Brinjal, Cabbage, Cauliflower, Carrot, Chillies Green, Ginger, Onion, Peas, Potato, Tomato, etc. are responsible for the decline in index. However, this decline was checked by Soyabean Oil, Mustard Oil, Sunflower Oil, Tea Leaf, Cooking Gas, Petrol, etc., putting upward pressure on the index.

At centre level, Ramgarh recorded the maximum decrease of 6points. Among others, 4 points decrease was observed in 3centres,3 points in 7 centres,2 points in 29centres and 1 point in 24centres. On the contrary, Solapur recorded a maximum increase of 2 points. Among others, 1 pointrise was observed in5centres.Rest of 18centres’ indices remained stationary.

Year-on-year inflation based on all-items stood at 3.67 per cent for December, 2020 as compared to 5.27 per cent for the previous month and 9.63 per cent during the corresponding month of the previous year. Similarly, Food inflation stood at 2.89per cent against 7.48per cent of the previous month and 12.22 per cent during the corresponding month a year ago.

Y-o-Y Inflation based on CPI-IW (Food and General)

Consumer Price Index

All-India Group-wise CPI-IW for November and December, 2020

Sr. No. Groups Nov, 2020 Dec, 2020
I Food & Beverages 123.6 119.7
II Pan, Supari, Tobacco & Intoxicants 133.1 133.3
III Clothing & Footwear 117.4 117.6
IV Housing 113.5* 113.5*
V Fuel & Light 126.8 132.4
VI Miscellaneous 117.2 117.6
General Index 119.9 118.8

*Rounded upfrom second decimal place.

CPI-IW: Groups Indices

CPI-IW Groups Indices

Speaking about the latest index, Shri Santosh Gangwar, Minister of State (I/C) for Labour and Employment said,the fall in inflation during December month is mainly due to food items which experienced a significant fall in retail prices on account of rise in supply. He added that the fall in inflation would imply increased purchasing power in the hands of Working class families.

Shri DPS Negi, Director General of Labour Bureau while releasing the index said, the fall in index during December, 2020 and fall in inflation rate are in line with other price indices compiled and released by other Government agencies.

He further said that it is mainly due to Food & Beverages group contributing (-) 1.53 percentage points to the total change. Among items, Rice, Poultry (Chicken), Orange, Brinjal, Cabbage, Cauliflower, Carrot, Chillies Green, Ginger, Onion, Peas, Potato, Tomato, etc. are responsible for the decline in index.

The next issue of CPI-IW for the month of January, 2021 will be released on Friday 26thFebruary, 2021. The same will also be available on the office website www.labourbureaunew.gov.in.

The Labour Bureau, an attached office of the M/o Labour & Employment, has been compiling Consumer Price Index for Industrial Workers every month on the basis of retail prices collected from 317 markets spread over 88 industrially important centres in the country. The index is compiled for 88 centres and All-India and is released on the last working day of succeeding month.

 Source: PIB

नोट :- हमारे वेबसाइट www.indiangovtscheme.com पर ऐसी जानकारी रोजाना आती रहती है, तो आप ऐसी ही सरकारी योजनाओं की जानकारी पाने के लिए हमारे वेबसाइट www.indiangovtscheme.com से जुड़े रहे। 
*****

Consumer Price Index for Industrial Workers (2016=100) – November, 2020

Consumer Price Index for Industrial Workers (2016=100) – November, 2020

 Ministry of Labour & Employment

Consumer Price Index for Industrial Workers (2016=100) – November, 2020

Posted On: 31 DEC 2020 5:51PM by PIB Delhi

The All-India CPI-IW for November, 2020 increased by 0.4 points and stood at 119.9 (one hundred nineteen and point nine). On 1-month percentage change, it increased by (+) 0.33 per cent between October and November, 2020 compared to (+) 0.92 per cent increase between corresponding months of previous year.

The maximum upward pressure in current index came from Food & Beverages group contributing (+) 0.25 percentage points to the total change. At item level, Rice, Arhar Dal, Fish Fresh, Milk, Mustard Oil, Soyabean Oil, Sunflower Oil, Onion, Potato, Chillies Dry, Tea Leaf, Cooked Meal, etc. are responsible for the increase in index. However, this increase was checked by Poultry (Chicken), Tomato, Brinjal, Carrot, Cauliflower, Ginger, Gourd, Green Coriander Leaves, Lady Finger, Peas, Orange, etc., putting downward pressure on the index.

At centre level, Puducherry recorded the maximum increase of 4 points. Among others, 3 points increase was observed in 4 centres, 2 points in 7 centres and 1 point in 30 centres. On the contrary, Guntur, Bhilai, Udham Singh Nagar and Vadodara recorded a maximum decrease of 2 points each. Among others, 1 point fall was observed in 17 centres. Rest of 25 centres’ indices remained stationary.

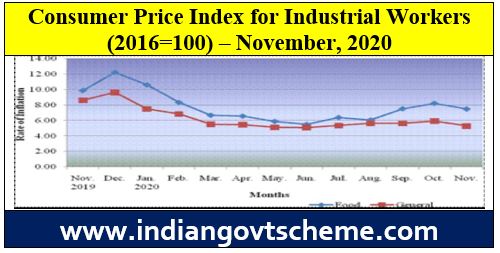
Year-on-year inflation based on all-items stood at 5.27 per cent for November, 2020 as compared to 5.91 per cent for the previous month and 8.61 per cent during the corresponding month of the previous year. Similarly, Food inflation stood at 7.48 per cent against 8.21 per cent of the previous month and 9.87 per cent during the corresponding month a year ago.

Y-o-Y Inflation based on CPI-IW (Food and General)

Consumer Price Index

All-India Group-wise CPI-IW for October and November, 2020

Sr. No. Groups

Oct, 2020

Nov, 2020

I Food & Beverages

123.0

123.6

II Pan, Supari, Tobacco & Intoxicants

132.5*

133.1

III Clothing & Footwear

117.4

117.4

IV Housing

113.5*

113.5*

V Fuel & Light

126.4

126.8

VI Miscellaneous

117.0

117.2

General Index

119.5

119.9

*Rounded up from second decimal place.

Speaking about the latest index, Shri Santosh Gangwar, Minister of State (I/C) for Labour and Employment said, “The rise in index coupled with fall in annual inflation will have dual impact in terms of increasing income and purchasing power of the workers. He added that the effect is mainly due to vegetables which had good supply in the market and provided respite to the consumers.

Shri DPS Negi, Director General of Labour Bureau while releasing the index said, “The rise in index during November, 2020 and fall in inflation rate are in line with other price indices compiled and released by other Government agencies”.

He further said that Rise in index is mainly on account of increase in prices of Rice, Arhar Dal, Fish Fresh, Milk, Mustard Oil, Soyabean Oil, Sunflower Oil, Onion, Potato, Chillies Dry, Tea Leaf, Cooked Meal, Cooking Gas, Household Goods & Services etc.

The next issue of CPI-IW for the month of December, 2020 will be released on Friday 29th January, 2021. The same will also be available on the office website www.labourbureaunew.gov.in.

The Labour Bureau, an attached office of the M/o Labour & Employment, has been compiling Consumer Price Index for Industrial Workers every month on the basis of retail prices collected from 317 markets spread over 88 industrially important centres in the country. The index is compiled for 88 centres and All-India and is released on the last working day of succeeding month.

Source : PIB

नोट :- हमारे वेबसाइट www.indiangovtscheme.com पर ऐसी जानकारी रोजाना आती रहती है, तो आप ऐसी ही सरकारी योजनाओं की जानकारी पाने के लिए हमारे वेबसाइट www.indiangovtscheme.com से जुड़े रहे।
*****

Consumer Price Index for Industrial Workers (CPI-IW) – April, 2019 औद्योगिक श्रमिकों के लिए उपभोक्ता मूल्य सूचकांक (सीपीआई-आईडब्ल्यू) – अप्रैल, 2019

Press Information Bureau 
Government of India
Ministry of Labour & Employment
03-June-2019 13:10 IST

Consumer Price Index for Industrial Workers (CPI-IW) – April, 2019 

The All-India CPI-IW for April, 2019 increased by 3 points and pegged at 312 (three hundred and twelve). On 1-month percentage change, it increased by (+) 0.97 per cent between March, 2019 and April, 2019 when compared with the increase of (+) 0.35 per cent between the corresponding months of previous year.

Consumer+Price+Index

The maximum upward pressure in current index came from Food group contributing (+) 2.26 percentage points to the total change. At item level, Arhar Dal, Fish Fresh, Goat Meat, Poultry (Chicken), Fresh Milk, Chillies Green, Garlic, Ginger, Onion, Apple, Banana, Lemon, Brinjal, Cabbage, Carrot, Cauliflower, French Bean, Green Coriander Leaves, Lady’s Finger, Methi, Palak, Peas, Potato, Radish, Tomato, Torai, Electricity Charges, Ornament Glass, etc. are responsible for the increase in index. However, this increase was checked by Eggs (Hen), Tamarind, Bitter Gourd, Parval, Cucumber, Kharbooza, Mango (Ripe), Flowers/ Flower Garlands, etc., putting downward pressure on the index.

The year-on-year inflation based on CPI-IW stood at 8.33 per cent for April, 2019 as compared to 7.67 per cent for the previous month and 3.97 per cent during the corresponding month of the previous year. Similarly, the Food inflation stood at (+) 4.92 per cent against (+) 3.96 per cent of the previous month and (+) 1.33 per cent during the corresponding month of the previous year.

At centre level Rourkela, Howrah and Siliguri reported the maximum increase of 7 points each followed by Mysore, Munger-Jamalpur and Varanasi (6 points each). Among others, 5 points increase was observed in 8 centres, 4 points in 8 centres, 3 points in 15 centres, 2 points in 23 centres and 1 point in 10 centres. Rest of the 8 centres’ indices remained stationary.

The indices of 35 centres are above All-India Index and 43 centres’ indices are below national average.

औद्योगिक श्रमिकों के लिए उपभोक्ता मूल्य सूचकांक  (सीपीआई-आईडब्ल्यू) – अप्रैल, 2019 

अप्रैल, 2019 के लिए अखिल भारतीय उपभोक्‍ता मूल्‍य सूचकांक सीपीआई-आईडब्ल्यू 3 अंकों की वृद्धि के साथ 312 (तीन सौ बारह) पर आ गई।  एक महीने के प्रतिशत बदलाव पर इसमें मार्च (2019) और अप्रैल, 2019 के बीच (+) 0.97 प्रतिशत की वृद्धि हुई जबकि पिछले वर्ष इसी महीनों के बीच इसमें (+) 0.35 प्रतिशत की वृद्धि हुई थी।

कुल बदलाव में वर्तमान सूचकांक में अधिकतम ऊपरी दबाव में खाद्य समूह (+) 2.26 प्रतिशत अंक का योगदान देता है। अरहर दाल, ताज़ा मछली, बकरी का मांस, पोल्ट्री (चिकन), ताज़ा दूध, हरी मिर्च, लहसुन, अदरक, प्याज, सेब, केला, नींबू, बैंगन, गोभी, गाजर, फूलगोभी, फ्रेंच बीन, हरा धनिया पत्‍ता, भिंडी, मेथी, पालक, मटर, आलू, मूली, टमाटर, तोरई, बिजली शुल्क, आभूषण ग्लास आदि सूचकांक में वृद्धि के लिए जिम्मेदार हैं। हालांकि, सूचकांक में इस वृद्धि में निचला दबाव डालते हुए अंडे (मुर्गी), इमली, करेला, परवल, ककड़ी, खरबूजा, आम (पके), फूल/फूल माला इत्‍यादि बाधा डालने का काम करते है।

सीपीआई-आईडब्ल्यू पर आधारित वर्ष-दर-वर्ष मुद्रास्फीति अप्रैल, 2019 के लिए 8.33 प्रतिशत पर थी, जबकि पिछले महीने यह 7.67 प्रतिशत और पिछले वर्ष के इसी महीने के दौरान 3.97 प्रतिशत थी। इसी तरह खाद्य महंगाई दर अप्रैल, 2019 में (+) 4.92 प्रतिशत, पिछले महीने 3.96 प्रतिशत और (+) 1.33 प्रतिशत पिछले वर्ष के इसी महीने के दौरान रही।

केंद्र स्तर पर राउरकेला,  हावड़ा और सिलीगुड़ी में मैसूर, मुंगेर-जमालपुर और वाराणसी (6 अंक प्रत्येक) के बाद 7 अंकों की अधिकतम वृद्धि दर्ज की गई। इसके अलावा, 8 केंद्रों के सूचकांक में 5 अंक की वृद्धि, 8 केंद्रों के सूचकांक में 4 अंक, 15 केंद्रों के सूचकांक में 3 अंक, 23 केंद्रों के सूचकांक में 2 अंक और 10 केंद्रों के सूचकांक में 1 अंक की वृद्धि दर्ज की गई। बाकी 8 केंद्रों के सूचकांक स्थिर रहे।
35 केंद्रों के सूचकांक अखिल भारतीय सूचकांक से ऊपर हैं और 43 केंद्रों के सूचकांक राष्ट्रीय औसत से नीचे हैं।

*****

Consumer Price Index for Industrial Workers (CPI-IW)-January, 2019 औद्योगिक श्रमिकों के लिए उपभोक्‍ता मूल्‍य सूचकांक (सीपीआई-आईडब्‍ल्‍यू) – जनवरी, 2019

पत्र सूचना कार्यालय 
भारत सरकार
श्रम एवं रोजगार मंत्रालय 
01-मार्च-2019 11:26 IST

औद्योगिक श्रमिकों के लिए उपभोक्‍ता मूल्‍य सूचकांक (सीपीआई-आईडब्‍ल्‍यू) – जनवरी, 2019 

औद्योगिक श्रमिकों के लिए अखिल भारतीय उपभोक्‍ता मूल्‍य सूचकांक (सीपीआई-आईडब्‍ल्‍यू) जनवरी 2019 में 6 अंक बढ़कर 307 अंक के स्‍तर पर आ गया। एक माह में हुए परिवर्तन के आधार पर सीपीआई-आईडब्‍ल्‍यू में दिसम्‍बर, 2018 से लेकर जनवरी, 2019 तक की अवधि के दौरान (+)1.99 प्रतिशत की वृद्धि दर्ज की गई, जबकि पिछले वर्ष की समान अवधि के दौरान इसमें (+)0.70 प्रतिशत की वृद्धि देखने को मिली थी। मौजूदा सूचकांक में सर्वाधिक वृद्धि आवासीय समूह के कारण आई है जिसने कुल परिवर्तन में (+)5.16 प्रतिशत का योगदान दिया है। विभिन्‍न वस्‍तुओं (आइटम) के आधार पर चावल, अरहर दाल, ताजा मछली, बकरे का मांस, नारियल तेल, भिंडी, टमाटर, फूल/फूलों की माला आदि सूचकांक में वृद्धि के कारक हैं, लेकिन प्‍याज, बैंगन, गोभी, गाजर, फूल गोभी, फली, लौकी, रसाई गैस, बिजली शुल्‍क आदि ने सूचकांक को नियंत्रित किया, जिसके फलस्‍वरूप सूचकांक में नीचे का दबाव देखा गया। 

consumer+price+index

मासिक सीपीआई-आईडब्‍ल्‍यू द्वारा मापी जाने वाली महंगाई दर पर वार्षिक आधार पर गौर करने से पता चलता है कि यह जनवरी, 2019 में 6.60 प्रतिशत रही, जो इससे पिछले महीने 5.24 प्रतिशत और पिछले साल के समान महीने में 5.11 प्रतिशत थी। इसी तरह खाद्य महंगाई दर (+)0.97 प्रतिशत रही, जबकि यह पिछले महीने (-)0.96 प्रतिशत और पिछले वर्ष के समान महीने में 3.36 प्रतिशत थी।

केन्‍द्रीय स्तर पर नागपुर में सर्वाधिक 21 अंकों की वृद्धि दर्ज की। इसके बाद नासिक  (17 अंक) अमृतसर, किलोन, झरिया (प्रत्‍येक 13 अंक) तथा जयपुर (12 अंक) ने अधिकतम वृद्धि दर्ज की। इसी तरह तीन केन्‍द्रों में 11 अंकों, 7 केन्‍द्रों में 10 अंकों, 3 केन्‍द्रों में 9 अंकों, 5 केन्‍द्रों में 8 अंकों, 9 केन्‍द्रों में 6 अंकों, 6 केन्‍द्रों में 5 अंकों, 7 केन्‍द्रों में 4 अंकों, 7 केन्‍द्रों में 3 अंकों, 7 केन्‍द्रों में 2 अंकों तथा 6 केन्‍द्रों में 1 अंक की वृद्धि देखी गई। 4 केन्‍द्रों में 2 अंकों की गिरावट तथा 2 केन्‍द्रों में 1 अंक की गिरावट देखी गई। शेष 4 केन्‍द्रों में सूचकांक स्थिर रहे।
35 केन्‍द्रों में सूचकांक दरअसल अखिल भारतीय सूचकांक से ज्‍यादा रहे हैं, जबकि 42 केन्‍द्रों में सूचकांक राष्‍ट्रीय औसत से कम रहे हैं। राउरकेला केन्‍द्र का सूचकांक अखिल भारतीय सूचकांक के बराबर रहा।
*****
Share via
Copy link