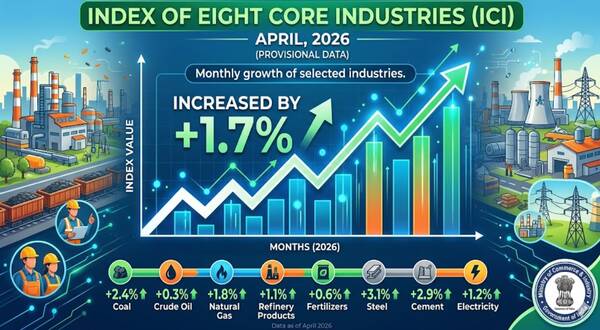
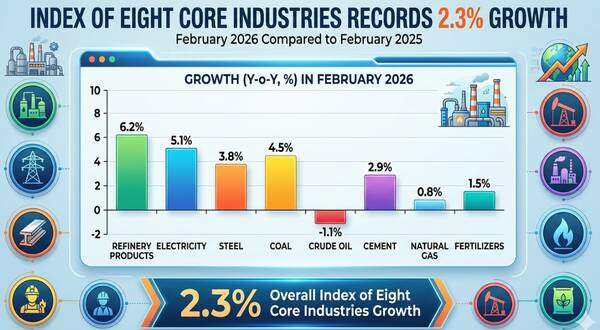
The Eight Core Industries comprise 40.27 per cent of the weight of items included in the Index of Industrial Production (IIP). The combined Index of Eight Core Industries stands at 128.4 in July 2018, which was 6.6per cent higher as compared to the index of July 2017. Its cumulative growth during April to July, 2018-19was 5.8per cent.
Coal
- Coal production (weight: 10.33per cent)increased by 9.7 per cent from July 2018 to July 2017. Its cumulative index increased by 12.3 per cent from April to July, 2018-19over corresponding period of the previous year.
Crude Oil
- Crude Oil production (weight: 8.98per cent) declined by 5.4 per cent in July 2018 over July 2017. Its cumulative index declined by 3.2 per cent during April to July, 2018-19over the corresponding period of the previous year.
Natural Gas
- The Natural Gas production (weight: 6.88per cent) declined by 5.2per cent in July 2018 to July 2017. Its cumulative index declined by 1.1 per cent during April to July 2018-19 over the corresponding period of previous year.
Refinery Products
- Petroleum Refinery production (weight: 28.04per cent) increased by 12.3 per cent in July 2018 to July 2017. Its cumulative index increased by 8.0 per cent during April to July, 2018-19over the corresponding period of the previous year.
Fertilizers
- Fertilizers production (weight: 2.63 per cent) increased by 1.3 per cent in July 2018 over July 2017. Its cumulative index increased by 3.7 per cent from April to July 2018-19 over the corresponding period of the previous year.
Steel
- Steel production (weight: 17.92per cent)increased by 6.0 per cent in July 2018 to July 2017. Its cumulative index increased by 3.2per cent during April to July 2018-19 over the corresponding period of the previous year.
Cement
- Cement production (weight: 5.37per cent) increased by 10.8per cent in July, 2018over July 2017. Its cumulative index increased by 14.7per cent from April to July, 2018-19over the corresponding period of the previous year.
Electricity
- Electricity generation (weight: 19.85per cent) increased by4.8per cent in July, 2018over July 2017. Its cumulative index increased by4.8per cent during April to July, 2018-19over the corresponding period of the previous year.
Note 1: Data for May 2018, June 2018 and July, 2018are provisional.
Note 2: Since April 2014, Electricity generation data from Renewable sources are also included.
Note 3: The industry-wise weights indicated above are individual industry weight derived from IIP and blown up on a pro-rata basis to a combined weight of ICI equal to 100.
Note 4: Release of the index for August 2018 will be on Monday, 1st October 2018.
| Sector | Weight | 2012-13 | 2013-14 | 2014-15 | 2015-16 | 2016-17 | 2017-18 | Apr-Jul 2017-18 | Apr-Jul 2018-19 |
| Coal | 10.3335 | 103.2 | 104.2 | 112.6 | 118.0 | 121.8 | 124.9 | 105.3 | 118.2 |
| Crude Oil | 8.9833 | 99.4 | 99.2 | 98.4 | 97.0 | 94.5 | 93.7 | 95.2 | 92.2 |
| Natural Gas | 6.8768 | 85.6 | 74.5 | 70.5 | 67.2 | 66.5 | 68.4 | 68.7 | 67.9 |
| Refinery Products | 28.0376 | 107.2 | 108.6 | 108.8 | 114.1 | 119.7 | 125.2 | 120.1 | 129.7 |
| Fertilizers | 2.6276 | 96.7 | 98.1 | 99.4 | 106.4 | 106.6 | 106.6 | 100.8 | 104.5 |
| Steel | 17.9166 | 107.9 | 115.8 | 121.7 | 120.2 | 133.1 | 140.5 | 136.6 | 141.0 |
| Cement | 5.3720 | 107.5 | 111.5 | 118.1 | 123.5 | 122.0 | 129.7 | 126.3 | 144.8 |
| Electricity | 19.8530 | 104.0 | 110.3 | 126.6 | 133.8 | 141.6 | 149.2 | 152.0 | 159.4 |
| Overall Index | 100.0000 | 103.8 | 106.5 | 111.7 | 115.1 | 120.5 | 125.7 | 121.9 | 128.9 |
| Sector | Weight | 2012-13 | 2013-14 | 2014-15 | 2015-16 | 2016-17 | 2017-18 | Apr-Jul 2017-18 | Apr-Jul 2018-19 |
| Coal | 10.3335 | 3.2 | 1.0 | 8.0 | 4.8 | 3.2 | 2.6 | -3.3 | 12.3 |
| Crude Oil | 8.9833 | -0.6 | -0.2 | -0.9 | -1.4 | -2.5 | -0.9 | 0.1 | -3.2 |
| Natural Gas | 6.8768 | -14.4 | -12.9 | -5.3 | -4.7 | -1.0 | 2.9 | 4.9 | -1.1 |
| Refinery Products | 28.0376 | 7.2 | 1.4 | 0.2 | 4.9 | 4.9 | 4.6 | 0.7 | 8.0 |
| Fertilizers | 2.6276 | -3.3 | 1.5 | 1.3 | 7.0 | 0.2 | 0.03 | -0.9 | 3.7 |
| Steel | 17.9166 | 7.9 | 7.3 | 5.1 | -1.3 | 10.7 | 5.6 | 7.0 | 3.2 |
| Cement | 5.3720 | 7.5 | 3.7 | 5.9 | 4.6 | -1.2 | 6.3 | -2.3 | 14.7 |
| Electricity | 19.8530 | 4.0 | 6.1 | 14.8 | 5.7 | 5.8 | 5.3 | 5.6 | 4.8 |
| Overall Index | 100.0000 | 3.8 | 2.6 | 4.9 | 3.0 | 4.8 | 4.3 | 2.6 | 5.8 |
| Sector | Coal | Crude Oil | Natural Gas | Refinery Products | Fertilizers | Steel | Cement | Electricity | Overall Index |
| Weight | 10.3335 | 8.9833 | 6.8768 | 28.0376 | 2.6276 | 17.9166 | 5.3720 | 19.8530 | 100.0000 |
| Jul-17 | 98.5 | 96.4 | 72.2 | 119.4 | 108.6 | 131.3 | 122.4 | 151.9 | 120.4 |
| Aug-17 | 101.3 | 95.1 | 69.5 | 121.6 | 115.4 | 139.0 | 117.3 | 155.4 | 123.0 |
| Sep-17 | 103.1 | 92.0 | 68.8 | 122.7 | 105.3 | 138.7 | 119.8 | 150.5 | 122.0 |
| Oct-17 | 119.4 | 95.7 | 71.0 | 132.1 | 116.8 | 146.7 | 125.2 | 149.8 | 128.7 |
| Nov-17 | 133.5 | 90.8 | 68.5 | 126.0 | 111.8 | 137.5 | 125.4 | 140.1 | 124.1 |
| Dec-17 | 142.6 | 94.2 | 69.2 | 133.1 | 112.1 | 138.0 | 135.3 | 143.9 | 128.8 |
| Jan-18 | 149.5 | 93.8 | 67.6 | 135.4 | 105.5 | 145.0 | 140.6 | 149.5 | 132.5 |
| Feb-18 | 143.2 | 86.1 | 62.1 | 120.9 | 102.2 | 141.7 | 138.0 | 136.1 | 123.2 |
| Mar-18 | 184.9 | 95.8 | 69.8 | 130.3 | 107.0 | 153.2 | 149.6 | 156.7 | 138.5 |
| Apr-18 | 118.8 | 91.8 | 67.1 | 119.1 | 93.1 | 138.1 | 149.1 | 153.7 | 124.3 |
| May-18 | 125.4 | 94.8 | 68.7 | 131.6 | 106.6 | 143.9 | 145.3 | 164.7 | 132.2 |
| Jun-18 | 120.3 | 90.9 | 67.4 | 133.8 | 108.3 | 142.7 | 149.5 | 159.9 | 131.0 |
| Jul-18 | 108.1 | 91.2 | 68.5 | 134.1 | 110.0 | 139.2 | 135.5 | 159.2 | 128.4 |
| Sector | Coal | Crude Oil | Natural Gas | Refinery Products | Fertilizers | Steel | Cement | Electricity | Overall Index |
| Weight | 10.3335 | 8.9833 | 6.8768 | 28.0376 | 2.6276 | 17.9166 | 5.3720 | 19.8530 | 100.0000 |
| Jul-17 | 0.6 | -0.5 | 6.6 | -2.7 | 0.2 | 9.4 | 1.0 | 6.6 | 2.9 |
| Aug-17 | 15.4 | -1.6 | 4.2 | 2.4 | -0.6 | 2.2 | 0.7 | 8.3 | 4.4 |
| Sep-17 | 10.4 | 0.1 | 6.3 | 8.1 | -7.7 | 3.7 | 0.1 | 3.4 | 4.7 |
| Oct-17 | 3.9 | -0.4 | 2.8 | 7.5 | 3.0 | 8.6 | -1.3 | 3.2 | 5.0 |
| Nov-17 | 0.7 | 0.2 | 2.4 | 8.2 | 0.3 | 14.5 | 16.9 | 3.9 | 6.9 |
| Dec-17 | 0.4 | -2.1 | 1.1 | 6.6 | 3.0 | 0.4 | 17.7 | 4.4 | 3.8 |
| Jan-18 | 3.8 | -3.2 | -1.2 | 11.0 | -1.6 | 1.7 | 19.6 | 7.7 | 6.2 |
| Feb-18 | 1.3 | -2.4 | -1.8 | 7.8 | 5.2 | 5.0 | 23.0 | 4.6 | 5.4 |
| Mar-18 | 9.1 | -1.6 | 1.0 | 1.1 | 3.2 | 4.7 | 13.5 | 6.0 | 4.5 |
| Apr-18 | 15.2 | -0.8 | 5.7 | 2.7 | 4.6 | 3.0 | 21.9 | 2.1 | 4.7 |
| May-18 | 12.2 | -2.9 | -1.4 | 4.9 | 8.4 | 0.7 | 13.0 | 4.1 | 4.3 |
| Jun-18 | 11.8 | -3.4 | -2.7 | 12.1 | 1.0 | 3.4 | 13.2 | 8.4 | 7.6 |
| Jul-18 | 9.7 | -5.4 | -5.2 | 12.3 | 1.3 | 6.0 | 10.8 | 4.8 | 6.6 |