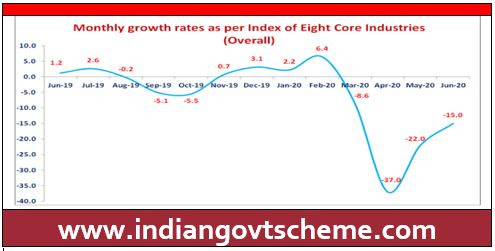
- Coal – Coal production (weight: 10.33 per cent) declined by 15.5 per cent in June, 2020 over June, 2019. Its cumulative index declined by 15.0 per cent during April to June, 2020-21 over corresponding period of the previous year.
- Crude Oil – Crude Oil production (weight: 8.98 per cent) declined by 6.0 per cent in June, 2020 over June, 2019. Its cumulative index declined by 6.5 per cent during April to June, 2020-21 over the corresponding period of previous year.
- Natural Gas – The Natural Gas production (weight: 6.88 per cent) declined by12.0 per cent in June, 2020 over June, 2019. Its cumulative index declined by 16.2 per cent during April to June, 2020-21 over the corresponding period of previous year.
- Refinery Products – Petroleum Refinery production (weight: 28.04 per cent) declined by 8.9 per cent in June, 2020 over June,2019. Its cumulative index declined by 18.2 per cent during April to June, 2020-21 over the corresponding period of previous year.
- Fertilizers– Fertilizers production (weight: 2.63 per cent) increased by 4.2 per cent in June, 2020 over June, 2019. Its cumulative index increased by 2.8 per cent during April to June, 2020-21 over the corresponding period of previous year.
- Steel – Steel production (weight: 17.92 per cent) declined by 33.8 per cent in June, 2020 over June, 2019. Its cumulative index declined by 51.7 per cent during April to June, 2020-21 over the corresponding period of previous year.
- Cement – Cement production (weight: 5.37 per cent) declined by 6.9 per cent in June, 2020 over June, 2019. Its cumulative index declined by 38.3 per cent during April to June, 2020-21 over the corresponding period of previous year.
- Electricity – Electricity generation (weight:19.85 per cent) declined by 11.0 per cent in June, 2020 over June, 2019. Its cumulative index declined by 16.1 per cent during April to June, 2020-21 over the corresponding period of previous year.
| Sector | Weight | 2012-13 | 2013-14 | 2014-15 | 2015-16 | 2016-17 | 2017-18 | 2018-19 | 2019-20 | Apr-Jun 2019-20 | Apr-Jun 2020-21 |
| Coal | 10.3335 | 103.2 | 104.2 | 112.6 | 118.0 | 121.8 | 124.9 | 134.1 | 133.6 | 124.5 | 105.8 |
| Crude Oil | 8.9833 | 99.4 | 99.2 | 98.4 | 97.0 | 94.5 | 93.7 | 89.8 | 84.5 | 86.2 | 80.6 |
| Natural Gas | 6.8768 | 85.6 | 74.5 | 70.5 | 67.2 | 66.5 | 68.4 | 69.0 | 65.1 | 67.1 | 56.2 |
| Refinery Products | 28.0376 | 107.2 | 108.6 | 108.8 | 114.1 | 119.7 | 125.2 | 129.1 | 129.4 | 125.1 | 102.3 |
| Fertilizers | 2.6276 | 96.7 | 98.1 | 99.4 | 106.4 | 106.6 | 106.6 | 107.0 | 109.8 | 101.5 | 104.3 |
| Steel | 17.9166 | 107.9 | 115.8 | 121.7 | 120.2 | 133.1 | 140.5 | 147.7 | 152.6 | 159.2 | 76.9 |
| Cement | 5.3720 | 107.5 | 111.5 | 118.1 | 123.5 | 122.0 | 129.7 | 147.0 | 145.7 | 149.9 | 92.5 |
| Electricity | 19.8530 | 104.0 | 110.3 | 126.6 | 133.8 | 141.6 | 149.2 | 156.9 | 158.4 | 171.1 | 143.5 |
| Overall Index | 100.0000 | 103.8 | 106.5 | 111.7 | 115.1 | 120.5 | 125.7 | 131.2 | 131.6 | 133.5 | 100.7 |
| Sector | Weight | 2012-13 | 2013-14 | 2014-15 | 2015-16 | 2016-17 | 2017-18 | 2018-19 | 2019-20 | Apr-Jun 2019-20 | Apr-Jun 2020-21 |
| Coal | 10.3335 | 3.2 | 1.0 | 8.0 | 4.8 | 3.2 | 2.6 | 7.4 | -0.4 | 2.6 | -15.0 |
| Crude Oil | 8.9833 | -0.6 | -0.2 | -0.9 | -1.4 | -2.5 | -0.9 | -4.1 | -5.9 | -6.8 | -6.5 |
| Natural Gas | 6.8768 | -14.4 | -12.9 | -5.3 | -4.7 | -1.0 | 2.9 | 0.8 | -5.6 | -1.0 | -16.2 |
| Refinery Products | 28.0376 | 7.2 | 1.4 | 0.2 | 4.9 | 4.9 | 4.6 | 3.1 | 0.2 | -2.4 | -18.2 |
| Fertilizers | 2.6276 | -3.3 | 1.5 | 1.3 | 7.0 | 0.2 | 0.03 | 0.3 | 2.7 | -1.1 | 2.8 |
| Steel | 17.9166 | 7.9 | 7.3 | 5.1 | -1.3 | 10.7 | 5.6 | 5.1 | 3.4 | 12.4 | -51.7 |
| Cement | 5.3720 | 7.5 | 3.7 | 5.9 | 4.6 | -1.2 | 6.3 | 13.3 | -0.9 | 1.0 | -38.3 |
| Electricity | 19.8530 | 4.0 | 6.1 | 14.8 | 5.7 | 5.8 | 5.3 | 5.2 | 0.9 | 7.3 | -16.1 |
| Overall Growth | 100.0000 | 3.8 | 2.6 | 4.9 | 3.0 | 4.8 | 4.3 | 4.4 | 0.4 | 3.4 | -24.6 |
| Sector | Coal | Crude Oil | Natural Gas | Refinery Products | Fertilizers | Steel | Cement | Electricity | Overall Index |
| Weight | 10.3335 | 8.9833 | 6.8768 | 28.0376 | 2.6276 | 17.9166 | 5.3720 | 19.8530 | 100.0000 |
| Jun-19 | 123.5 | 84.7 | 66.0 | 121.4 | 110.0 | 159.3 | 147.9 | 173.6 | 132.8 |
| Jul-19 | 106.4 | 87.2 | 68.1 | 132.9 | 111.7 | 151.7 | 146.5 | 170.5 | 132.6 |
| Aug-19 | 94.8 | 86.6 | 67.4 | 131.0 | 112.6 | 150.0 | 127.7 | 165.7 | 128.5 |
| Sep-19 | 87.3 | 83.4 | 64.3 | 117.5 | 113.9 | 141.2 | 131.3 | 158.7 | 120.7 |
| Oct-19 | 109.6 | 86.3 | 66.3 | 134.2 | 115.5 | 149.5 | 137.0 | 145.8 | 127.4 |
| Nov-19 | 133.6 | 82.4 | 64.4 | 133.0 | 116.7 | 154.9 | 142.4 | 139.9 | 129.2 |
| Dec-19 | 152.9 | 83.5 | 65.5 | 130.5 | 120.5 | 165.2 | 159.2 | 150.2 | 135.5 |
| Jan-20 | 164.7 | 85.0 | 65.3 | 134.4 | 116.5 | 155.4 | 164.1 | 155.6 | 137.4 |
| Feb-20 | 171.1 | 75.6 | 58.3 | 128.9 | 107.8 | 152.9 | 160.7 | 153.6 | 134.0 |
| Mar-20 | 209.7 | 85.0 | 60.1 | 135.3 | 98.3 | 133.2 | 129.8 | 146.9 | 134.0 |
| Apr-20 | 103.7 | 80.2 | 53.3 | 94.2 | 85.0 | 33.3 | 22.5 | 125.5 | 82.3 |
| May-20 | 109.4 | 82.0 | 57.2 | 102.0 | 113.4 | 92.1 | 117.3 | 150.6 | 106.9 |
| Jun-20 | 104.3 | 79.6 | 58.1 | 110.6 | 114.6 | 105.4 | 137.7 | 154.5 | 112.9 |
| Sector | Coal | Crude Oil | Natural Gas | Refinery Products | Fertilizers | Steel | Cement | Electricity | Overall Growth |
| Weight | 10.3335 | 8.9833 | 6.8768 | 28.0376 | 2.6276 | 17.9166 | 5.3720 | 19.8530 | 100.0000 |
| Jun-19 | 2.9 | -6.8 | -2.1 | -9.3 | 1.5 | 10.8 | -1.9 | 8.6 | 1.2 |
| Jul-19 | -1.6 | -4.4 | -0.5 | -0.9 | 1.5 | 8.1 | 7.7 | 5.2 | 2.6 |
| Aug-19 | -8.6 | -5.4 | -3.9 | 2.6 | 2.9 | 3.8 | -5.1 | -0.9 | -0.2 |
| Sep-19 | -20.5 | -5.4 | -4.9 | -6.6 | 5.4 | -1.4 | -2.0 | -2.6 | -5.1 |
| Oct-19 | -17.6 | -5.1 | -5.6 | 0.4 | 11.8 | -0.5 | -7.7 | -12.2 | -5.5 |
| Nov-19 | -3.5 | -6.0 | -6.4 | 3.1 | 13.6 | 7.0 | 4.3 | -4.9 | 0.7 |
| Dec-19 | 6.1 | -7.4 | -9.2 | 3.0 | 10.2 | 8.7 | 5.5 | 0.0 | 3.1 |
| Jan-20 | 8.0 | -5.3 | -9.0 | 1.9 | -0.1 | 1.6 | 5.1 | 3.2 | 2.2 |
| Feb-20 | 11.3 | -6.4 | -9.6 | 7.4 | 2.9 | 2.9 | 7.8 | 11.5 | 6.4 |
| Mar-20 | 4.0 | -5.5 | -15.1 | -0.5 | -11.9 | -21.9 | -25.1 | -8.2 | -8.6 |
| Apr-20 | -15.5 | -6.4 | -19.9 | -24.2 | -4.5 | -78.7 | -85.3 | -23.0 | -37.0 |
| May-20 | -14.0 | -7.1 | -16.8 | -21.3 | 7.5 | -43.1 | -21.4 | -14.8 | -22.0 |
| Jun-20 | -15.5 | -6.0 | -12.0 | -8.9 | 4.2 | -33.8 | -6.9 | -11.0 | -15.0 |