
Wholesale Inflation Rises to 12.29% in October 2026 from 11.39% in September
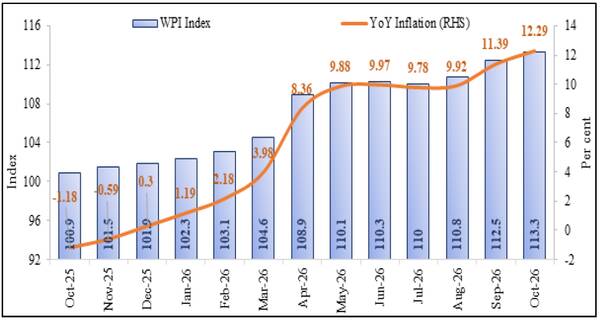
अक्टूबर 2026 में देश की थोक महंगाई दर (WPI Inflation) में बढ़ोतरी दर्ज की गई है। सालाना आधार (YoY) पर थोक महंगाई दर बढ़कर 12.29 प्रतिशत हो गई, जबकि सितंबर 2026 में यह 11.39 प्रतिशत थी।
आंकड़ों के अनुसार, अक्टूबर 2026 में सभी वस्तुओं का थोक मूल्य सूचकांक (All Commodities Index) बढ़कर 113.3 पर पहुंच गया, जबकि सितंबर में यह 112.5 था।
थोक महंगाई दर में यह वृद्धि बाजार में वस्तुओं की कीमतों पर बढ़ते दबाव को दर्शाती है। इसका असर कारोबारियों, उद्योगों और आम उपभोक्ताओं पर पड़ सकता है। आने वाले समय में महंगाई की स्थिति पर खाद्य पदार्थों, ईंधन और विनिर्मित वस्तुओं की कीमतों का प्रभाव महत्वपूर्ण रहेगा।
Ministry of Commerce & Industry
PROVISIONAL WHOLESALE PRICE INDEX, OUTPUT PRODUCER PRICE INDEX, AND TRIAL INPUT PRODUCER PRICE INDEX FOR THE MONTH OF OCTOBER 2026, AND FINAL INDEX FOR THE MONTH OF AUGUST 2026
Provisional Wholesale Price Index (Base Year 2022-23) for the month of October 2026
Posted On: 16 NOV 2026 12:00PM by PIB Delhi
Key highlights of WPI (Base Year 2022-23) for October 2026
1. All India Wholesale Price Index (WPI) inflation for October 2026 is 12.29 per cent on year-on-year (YoY) basis, compared to 11.39 per cent in September 2026. The index for All Commodities for October 2026 stands at 113.3, whereas it was 112.5 in September 2026.
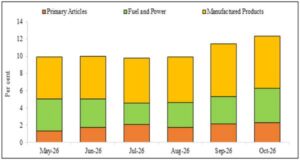
2. YoY inflation rates for major groups, namely, Primary Articles, Fuel and Power, and Manufactured Products are 9.24 per cent, 32.84 per cent, and 9.54 per cent, respectively in October 2026, compared to 8.67 per cent, 25.85 per cent, and 9.76 per cent, respectively in September 2026. The indices for Primary Articles, Fuel and Power, and Manufactured Products are 120.6, 115.7, and 110.2, respectively, in October 2026, whereas they were 120.3, 110.5, and 110.2, respectively, in September 2026.
3. Across groups, ‘Mineral Oils (containing Petroleum Products)’, ‘Crude Petroleum and Natural Gas’, ‘Electricity’, ‘Food Articles’, ‘Manufacture of Basic Metals’, ‘Manufacture of Chemicals and Chemical Products’, ‘Manufacture of Food Products’, ‘Non-Food Articles’, ‘Manufacture of Textiles’, and ‘Manufacture of Rubber and Plastic Products’ have been drivers of WPI inflation in October 2026.
4. WPI Food Index (weight=24.99 per cent): The Food Index consists of ‘Food Articles’ from Primary Articles major group, and ‘Manufacture of Food Products’ from Manufactured Products major group. It observed a YoY inflation of 8.58 per cent in October 2026, compared to 8.66 per cent in September 2026.
5. Monthly indices and Inflation Rate (in per cent) for All commodities and Major Groups, along with major group-wise contribution for the past months are presented in the charts below.
Chart 1: WPI Index and Inflation Rate for All Commodities
Chart 2: WPI Index of Major Groups
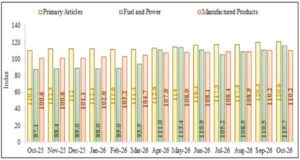
Chart 3: Inflation Rate across Major Groups
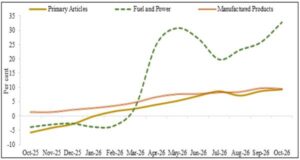
Chart 4: Major Group-Wise contribution to Inflation
1. The final index for the month of August 2026 remains unchanged at 110.8 as compared to the provisional index. Accordingly, the WPI inflation rate for August 2026 also remains unchanged at 9.92 per cent (final).
2. The final index of WPI (Base Year 2022-23) for the month of August 2026 has been compiled with a weighted response rate of 99.37 per cent.
3. The provisional index of WPI (Base Year 2022-23) for the month of October 2026 has been compiled with a weighted response rate of 81.1 per cent.
4. Wholesale Price Index and Year-on-Year (YoY) Inflation Rate for All Commodities, Major Groups, and Groups for the last six months is given at Annexure-I and II respectively.
5. Cumulative WPI for All Commodities, Major Groups, and Groups from April to October for FY 2023-24, FY 2024-25, FY 2025-26, and FY 2026-27 is given at Annexure-III.
6. Cumulative YoY Inflation Rate for All Commodities, Major Groups, and Groups from April to October for FY 2024-25, FY 2025-26, and FY 2026-27 is given at Annexure- IV.
7. Item-wise data pertaining to WPI (Base Year 2022-23) series from April 2023 to October 2026 is available at (https://eaindustry.nic.in/download_data_2223.asp).
8. Provisional indices of WPI, OPPI, and trial IPPI for a reference month are released on the 14th of the following month (if it is a working day, else on next working day). Accordingly, release of WPI, Output PPI, and trial Input PPI for the month of November 2026 will be on Monday, 14th December 2026.
Annexure-I
WPI for All Commodities, Major Groups and Groups for last six months
Groups/Major Groups | Commodity Weight | May-26 (F) | Jun-26 (F) | Jul-26 (F) | Aug-26 (F) | Sep-26 (P) | Oct-26 (P) |
| ALL COMMODITIES | 100.00000 | 110.1 | 110.3 | 110.0 | 110.8 | 112.5 | 113.3 |
| I. PRIMARY ARTICLES | 22.75730 | 114.0 | 116.1 | 117.3 | 117.4 | 120.3 | 120.6 |
| (A). Food Articles | 15.97835 | 115.1 | 117.2 | 118.2 | 118.5 | 122.2 | 121.9 |
| (B). Non-Food Articles | 5.52841 | 109.1 | 111 | 112.6 | 112.4 | 113.7 | 115.6 |
| (C). Minerals | 1.25054 | 121.0 | 123.8 | 125.8 | 125.4 | 125.5 | 126.5 |
| II. FUEL AND POWER | 14.11433 | 113.4 | 110.9 | 105.2 | 108.5 | 110.5 | 115.7 |
| (A). Coal and Lignite | 0.74136 | 86.6 | 87.9 | 88.4 | 90.5 | 95.1 | 96.9 |
| (B). Mineral Oils | 8.19208 | 125.7 | 122.9 | 113.2 | 118.4 | 119.3 | 124.9 |
| (C). Electricity | 4.46349 | 91.5 | 91.2 | 91.8 | 91.4 | 92.0 | 96.5 |
| (D). Crude Petroleum & Natural Gas | 0.71740 | 136.8 | 120.2 | 114.8 | 120.3 | 141.9 | 148.6 |
| III. MANUFACTURED PRODUCTS | 63.12837 | 108.0 | 108.1 | 108.4 | 108.9 | 110.2 | 110.2 |
| (A). Manufacture of Food Products | 9.02016 | 112.4 | 113.5 | 114.9 | 116.5 | 117.1 | 117.1 |
| (B). Manufacture of Beverages | 0.90483 | 104.9 | 105.1 | 104.6 | 105.3 | 105.9 | 106.0 |
| (C). Manufacture of Tobacco Products | 0.27645 | 122.8 | 124.8 | 125.1 | 125.2 | 124.3 | 125.7 |
| (D). Manufacture of Textiles | 4.08993 | 102.1 | 103.4 | 103.9 | 104 | 105.2 | 104.8 |
| (E). Manufacture of Wearing Apparel | 1.32948 | 111.6 | 111.9 | 111.9 | 112.2 | 113.1 | 112.7 |
| (F). Manufacture of Leather and Related Products | 0.54137 | 108.4 | 108.9 | 108.7 | 108.7 | 109.1 | 109.3 |
| (G). Manufacture Of Wood and Products of Wood and Cork, except Furniture; Manufacture of Articles of Straw and Plaiting Materials | 1.07718 | 115.0 | 115.4 | 115.9 | 115.6 | 115.3 | 115.4 |
| (H). Manufacture of Paper and Paper Products | 1.15328 | 94.1 | 93.8 | 94.4 | 94.7 | 96.0 | 96.9 |
| (I). Printing and Reproduction of Recorded Media | 0.42618 | 108.1 | 108.0 | 108.0 | 108.0 | 108.6 | 108.3 |
| (J). Manufacture of Chemicals and Chemical Products | 6.12567 | 103.6 | 103.8 | 103.0 | 104.0 | 106.0 | 106.6 |
| (K). Manufacture of Basic Pharmaceutical Products and Pharmaceutical Preparations | 2.20102 | 102.9 | 102.8 | 103.2 | 102.6 | 103.8 | 102.9 |
| (L). Manufacture of Rubber and Plastic Products | 2.71467 | 106.3 | 106.7 | 106.6 | 107.1 | 108.7 | 109.0 |
| (M). Manufacture of Other Non-Metallic Mineral Products | 2.84074 | 99.2 | 99.8 | 100.0 | 99.6 | 100.4 | 100.2 |
| (N). Manufacture of Basic Metals | 8.41133 | 104.9 | 101.6 | 102.0 | 102.7 | 106.2 | 106.9 |
| (O). Manufacture of Fabricated Metal Products, except Machinery and Equipment | 4.13294 | 105.9 | 106.1 | 106.6 | 106.8 | 107.4 | 107.4 |
| (P). Manufacture of Computer, Electronic and Optical Products | 2.07628 | 102.7 | 103.4 | 103.2 | 103.6 | 104.1 | 104.3 |
| (Q). Manufacture of Electrical Equipment | 2.64318 | 114.2 | 115.0 | 115.5 | 116.1 | 117.3 | 116.8 |
| (R). Manufacture of Machinery and Equipment n.e.c. | 3.46796 | 105.3 | 105.5 | 106.2 | 106.2 | 106.6 | 106.7 |
| (S). Manufacture of Motor Vehicles, Trailers and Semi-Trailers | 5.43645 | 107.0 | 108.7 | 109.1 | 109.5 | 110.0 | 110.3 |
| (T). Manufacture of Other Transport Equipment | 1.39511 | 106.4 | 107.2 | 108.1 | 108.1 | 109.0 | 108.7 |
| (U). Manufacture of Furniture | 0.82618 | 105.6 | 105.8 | 105.7 | 105.4 | 105.7 | 106.8 |
| (V). Other Manufacturing | 2.03798 | 158.2 | 156.8 | 154.2 | 154.2 | 156.1 | 152.1 |
| FOOD INDEX | 24.99851 | 114.1 | 115.9 | 117.0 | 117.8 | 120.4 | 120.2 |
(P)-Provisional, (F)-Final
Annexure-II
WPI Inflation Rate (YoY) for All Commodities, Major Groups, and Groups for last six months
Groups/Major Groups | Commodity Weight | May-26 (F) | Jun-26 (F) | Jul-26 (F) | Aug-26 (F) | Sep-26 (P) | Oct-26 (P) |
| ALL COMMODITIES | 100.00000 | 9.88 | 9.97 | 9.78 | 9.92 | 11.39 | 12.29 |
| I. PRIMARY ARTICLES | 22.75730 | 5.26 | 7.00 | 8.61 | 7.12 | 8.67 | 9.24 |
| (A). Food Articles | 15.97835 | 3.69 | 5.40 | 5.44 | 4.96 | 8.14 | 8.26 |
| (B). Non-Food Articles | 5.52841 | 10.20 | 11.67 | 17.66 | 13.88 | 10.28 | 11.69 |
| (C). Minerals | 1.25054 | 6.05 | 8.31 | 13.64 | 8.76 | 9.51 | 12.64 |
| II. FUEL AND POWER | 14.11433 | 30.80 | 27.18 | 19.82 | 23.16 | 25.85 | 32.84 |
| (A). Coal and Lignite | 0.74136 | -2.26 | -1.57 | -0.56 | 1.57 | 9.31 | 10.49 |
| (B). Mineral Oils | 8.19208 | 49.82 | 46.48 | 32.4 | 38.48 | 40.02 | 45.57 |
| (C). Electricity | 4.46349 | -0.54 | -1.51 | 0.44 | -1.19 | -0.43 | 8.06 |
| (D). Crude Petroleum & Natural Gas | 0.71740 | 61.51 | 34.75 | 26.99 | 34.41 | 57.32 | 70.80 |
| III. MANUFACTURED PRODUCTS | 63.12837 | 7.68 | 7.78 | 8.29 | 8.47 | 9.76 | 9.54 |
| (A). Manufacture of Food Products | 9.02016 | 6.24 | 7.58 | 8.70 | 9.18 | 9.44 | 9.24 |
| (B). Manufacture of Beverages | 0.90483 | 1.25 | 1.15 | 0.48 | 1.54 | 1.44 | 2.12 |
| (C). Manufacture of Tobacco Products | 0.27645 | 12.76 | 14.60 | 13.73 | 13.71 | 12.90 | 13.24 |
| (D). Manufacture of Textiles | 4.08993 | 10.98 | 12.15 | 12.69 | 12.31 | 13.85 | 13.67 |
| (E). Manufacture of Wearing Apparel | 1.32948 | 3.72 | 2.57 | 3.61 | 2.94 | 3.57 | 3.30 |
| (F). Manufacture of Leather and Related Products | 0.54137 | 4.23 | 3.91 | 3.92 | 3.52 | 3.71 | 5.60 |
| (G). Manufacture Of Wood and Products of Wood and Cork, except Furniture; Manufacture of Articles of Straw and Plaiting Materials | 1.07718 | 6.58 | 7.65 | 7.41 | 7.53 | 5.97 | 5.68 |
| (H). Manufacture of Paper and Paper Products | 1.15328 | 2.95 | 3.19 | 3.40 | 4.18 | 5.15 | 6.72 |
| (I). Printing and Reproduction of Recorded Media | 0.42618 | 3.94 | 3.45 | 3.25 | 2.56 | 3.04 | 3.24 |
| (J). Manufacture of Chemicals and Chemical Products | 6.12567 | 14.73 | 14.32 | 13.56 | 14.41 | 16.74 | 17.53 |
| (K). Manufacture of Basic Pharmaceutical Products and Pharmaceutical Preparations | 2.20102 | 3.94 | 3.42 | 4.35 | 2.70 | 4.01 | 3.00 |
| (L). Manufacture of Rubber and Plastic Products | 2.71467 | 10.84 | 10.46 | 10.70 | 10.87 | 13.47 | 13.90 |
| (M). Manufacture of Other Non-Metallic Mineral Products | 2.84074 | 1.33 | 2.04 | 2.77 | 2.47 | 3.72 | 3.94 |
| (N). Manufacture of Basic Metals | 8.41133 | 13.16 | 10.68 | 12.33 | 12.86 | 16.96 | 17.21 |
| (O). Manufacture of Fabricated Metal Products, except Machinery and Equipment | 4.13294 | 6.33 | 6.53 | 7.24 | 7.01 | 7.51 | 7.72 |
| (P). Manufacture of Computer, Electronic and Optical Products | 2.07628 | -0.87 | -0.86 | -1.81 | -1.61 | 4.00 | 4.20 |
| (Q). Manufacture of Electrical Equipment | 2.64318 | 11.41 | 11.22 | 11.38 | 11.21 | 11.93 | 10.40 |
| (R). Manufacture of Machinery and Equipment n.e.c. | 3.46796 | 2.23 | 2.23 | 2.81 | 2.41 | 2.80 | 2.99 |
| (S). Manufacture of Motor Vehicles, Trailers and Semi-Trailers | 5.43645 | 0.75 | 3.23 | 3.31 | 3.89 | 4.46 | 4.35 |
| (T). Manufacture of Other Transport Equipment | 1.39511 | 4.11 | 4.69 | 4.85 | 4.44 | 4.21 | 3.62 |
| (U). Manufacture of Furniture | 0.82618 | 5.18 | 4.44 | 4.24 | 4.98 | 5.17 | 6.37 |
| (V). Other Manufacturing | 2.03798 | 21.41 | 20.71 | 20.28 | 22.19 | 19.16 | 11.92 |
| FOOD INDEX | 24.99851 | 4.58 | 6.23 | 6.56 | 6.41 | 8.66 | 8.58 |
(P)-Provisional, (F)-Final
Annexure-III
Cumulative WPI for All Commodities, Major Groups, and Groups
Groups/Major Groups | Commodity Weight | Apr-Oct FY 2023-24 | Apr-Oct FY 2024-25 | Apr-Oct FY 2025-26 | Apr-Oct FY 2026-27 |
| ALL COMMODITIES | 100.00000 | 99.2 | 100.9 | 100.6 | 110.8 |
| I. PRIMARY ARTICLES | 22.75730 | 105.4 | 112.9 | 109.1 | 116.9 |
| (A). Food Articles | 15.97835 | 107.6 | 117.7 | 112.0 | 118.2 |
| (B). Non-Food Articles | 5.52841 | 99.8 | 98.8 | 99.9 | 111.7 |
| (C). Minerals | 1.25054 | 100.9 | 113.5 | 113.0 | 123.8 |
| II. FUEL AND POWER | 14.11433 | 92.5 | 90.9 | 87.6 | 110.7 |
| (A). Coal and Lignite | 0.74136 | 92.8 | 90.0 | 88.5 | 90.4 |
| (B). Mineral Oils | 8.19208 | 90.7 | 89.1 | 85.2 | 120.9 |
| (C). Electricity | 4.46349 | 94.9 | 93.1 | 91.9 | 92.2 |
| (D). Crude Petroleum & Natural Gas | 0.71740 | 98.2 | 99.0 | 88.5 | 131.6 |
| III. MANUFACTURED PRODUCTS | 63.12837 | 98.4 | 98.8 | 100.3 | 108.7 |
| (A). Manufacture of Food Products | 9.02016 | 98.7 | 101.8 | 106.3 | 114.6 |
| (B). Manufacture of Beverages | 0.90483 | 102.4 | 103.8 | 103.9 | 105.2 |
| (C). Manufacture of Tobacco Products | 0.27645 | 104.6 | 107.0 | 109.8 | 124.3 |
| (D). Manufacture of Textiles | 4.08993 | 92.7 | 92.6 | 92.3 | 103.2 |
| (E). Manufacture of Wearing Apparel | 1.32948 | 102.6 | 105.0 | 108.5 | 112.1 |
| (F). Manufacture of Leather and Related Products | 0.54137 | 101.7 | 102.1 | 104.3 | 108.6 |
| (G). Manufacture Of Wood and Products of Wood and Cork, except Furniture; Manufacture of Articles of Straw and Plaiting Materials | 1.07718 | 102.2 | 103.7 | 107.9 | 115.4 |
| (H). Manufacture of Paper and Paper Products | 1.15328 | 90.3 | 90.1 | 91.2 | 94.8 |
| (I). Printing and Reproduction of Recorded Media | 0.42618 | 103.8 | 104.4 | 104.6 | 108.0 |
| (J). Manufacture of Chemicals and Chemical Products | 6.12567 | 92.9 | 91.2 | 90.7 | 104.2 |
| (K). Manufacture of Basic Pharmaceutical Products and Pharmaceutical Preparations | 2.20102 | 100.9 | 99.8 | 99.5 | 102.9 |
| (L). Manufacture of Rubber and Plastic Products | 2.71467 | 95.3 | 96.3 | 96.2 | 107.2 |
| (M). Manufacture of Other Non-Metallic Mineral Products | 2.84074 | 99.4 | 95.7 | 97.2 | 99.7 |
| (N). Manufacture of Basic Metals | 8.41133 | 94.8 | 92.9 | 91.7 | 104.0 |
| (O). Manufacture of Fabricated Metal Products, except Machinery and Equipment | 4.13294 | 100.2 | 99.7 | 99.6 | 106.4 |
| (P). Manufacture of Computer, Electronic and Optical Products | 2.07628 | 98.5 | 97.4 | 103.1 | 103.3 |
| (Q). Manufacture of Electrical Equipment | 2.64318 | 100.6 | 102.1 | 104.0 | 115.4 |
| (R). Manufacture of Machinery and Equipment n.e.c. | 3.46796 | 102.0 | 102.4 | 103.4 | 105.9 |
| (S). Manufacture of Motor Vehicles, Trailers and Semi-Trailers | 5.43645 | 104.1 | 105.9 | 105.6 | 108.8 |
| (T). Manufacture of Other Transport Equipment | 1.39511 | 101.5 | 101.2 | 103.3 | 107.6 |
| (U). Manufacture of Furniture | 0.82618 | 101.6 | 101.7 | 100.9 | 105.8 |
| (V). Other Manufacturing | 2.03798 | 104.4 | 111.1 | 129.4 | 155.5 |
| FOOD INDEX | 24.99851 | 104.4 | 112.0 | 109.9 | 116.9 |
Note: Cumulative Index has been calculated by taking Arithmetic Mean of 7 months indices
Annexure-IV
Cumulative WPI Inflation Rate (YoY) for All Commodities, Major Groups, and Groups
Groups/Major Groups | Commodity Weight | Apr-Oct FY 2024-25 | Apr-Oct FY 2025-26 | Apr-Oct FY 2026-27 |
| ALL COMMODITIES | 100.00000 | 1.71 | -0.30 | 10.14 |
| I. PRIMARY ARTICLES | 22.75730 | 7.12 | -3.37 | 7.15 |
| (A). Food Articles | 15.97835 | 9.39 | -4.84 | 5.54 |
| (B). Non-Food Articles | 5.52841 | -1.00 | 1.11 | 11.81 |
| (C). Minerals | 1.25054 | 12.49 | -0.44 | 9.56 |
| II. FUEL AND POWER | 14.11433 | -1.73 | -3.63 | 26.37 |
| (A). Coal and Lignite | 0.74136 | -3.02 | -1.67 | 2.15 |
| (B). Mineral Oils | 8.19208 | -1.76 | -4.38 | 41.9 |
| (C). Electricity | 4.46349 | -1.90 | -1.29 | 0.33 |
| (D). Crude Petroleum & Natural Gas | 0.71740 | 0.81 | -10.61 | 48.70 |
| III. MANUFACTURED PRODUCTS | 63.12837 | 0.41 | 1.52 | 8.37 |
| (A). Manufacture of Food Products | 9.02016 | 3.14 | 4.42 | 7.81 |
| (B). Manufacture of Beverages | 0.90483 | 1.37 | 0.10 | 1.25 |
| (C). Manufacture of Tobacco Products | 0.27645 | 2.29 | 2.62 | 13.21 |
| (D). Manufacture of Textiles | 4.08993 | -0.11 | -0.32 | 11.81 |
| (E). Manufacture of Wearing Apparel | 1.32948 | 2.34 | 3.33 | 3.32 |
| (F). Manufacture of Leather and Related Products | 0.54137 | 0.39 | 2.15 | 4.12 |
| (G). Manufacture Of Wood and Products of Wood and Cork, except Furniture; Manufacture of Articles of Straw and Plaiting Materials | 1.07718 | 1.47 | 4.05 | 6.95 |
| (H). Manufacture of Paper and Paper Products | 1.15328 | -0.22 | 1.22 | 3.95 |
| (I). Printing and Reproduction of Recorded Media | 0.42618 | 0.58 | 0.19 | 3.25 |
| (J). Manufacture of Chemicals and Chemical Products | 6.12567 | -1.83 | -0.55 | 14.88 |
| (K). Manufacture of Basic Pharmaceutical Products and Pharmaceutical Preparations | 2.20102 | -1.09 | -0.30 | 3.42 |
| (L). Manufacture of Rubber and Plastic Products | 2.71467 | 1.05 | -0.10 | 11.43 |
| (M). Manufacture of Other Non-Metallic Mineral Products | 2.84074 | -3.72 | 1.57 | 2.57 |
| (N). Manufacture of Basic Metals | 8.41133 | -2.00 | -1.29 | 13.41 |
| (O). Manufacture of Fabricated Metal Products, except Machinery and Equipment | 4.13294 | -0.50 | -0.10 | 6.83 |
| (P). Manufacture of Computer, Electronic and Optical Products | 2.07628 | -1.12 | 5.85 | 0.19 |
| (Q). Manufacture of Electrical Equipment | 2.64318 | 1.49 | 1.86 | 10.96 |
| (R). Manufacture of Machinery and Equipment n.e.c. | 3.46796 | 0.39 | 0.98 | 2.42 |
| (S). Manufacture of Motor Vehicles, Trailers and Semi-Trailers | 5.43645 | 1.73 | -0.28 | 3.03 |
| (T). Manufacture of Other Transport Equipment | 1.39511 | -0.30 | 2.08 | 4.16 |
| (U). Manufacture of Furniture | 0.82618 | 0.10 | -0.79 | 4.86 |
| (V). Other Manufacturing | 2.03798 | 6.42 | 16.47 | 20.17 |
| FOOD INDEX | 24.99851 | 7.28 | -1.87 | 6.37 |
Provisional Output Producer Price Index (Base Year 2022-23) for the month of October 2026
1. Key highlights of Output PPI (Base Year 2022-23) for October 2026
1. All India Output PPI for All Commodities for October 2026 stands at 113.3, whereas it was 112.5 in September 2026.
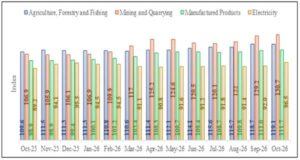
2. Output PPIs for Agriculture, Forestry and Fishing; Mining and Quarrying; Manufactured Products; and Electricity are 119.1, 130.7, 111.7, and 96.5, respectively, in October 2026, whereas those were 118.7, 129.2, 111.0, and 92.0, respectively, in September 2026.
3. Monthly indices for All Commodities and Major Groups, for the past 13 months are presented in the charts below.
Chart 5: Output PPI for All Commodities
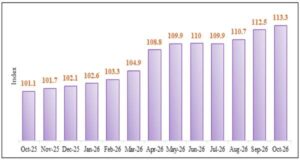
Chart 6: Output PPI across Major Groups
2. The final index of Output PPI for the month of August 2026 has been revised from 110.8 (Provisional) to 110.7.
3. Output PPI for All Commodities, Major Groups, and Groups for the last six months is given at Annexure-V.
4. Cumulative Output PPI for All Commodities, Major Groups, and Groups from April to October for FY 2023-24, FY 2024-25, FY 2025-26, and FY 2026-27 is given at Annexure-VI.
5. SUT category-wise index pertaining to Output PPI (Base Year 2022-23) series from April 2023 to October 2026 is available at (https://eaindustry.nic.in/download_data_2223.asp).
Annexure-V
Output PPI for All Commodities, Major Groups and Groups for last six months
Groups/Major Groups | Weight | May-26 (F) | Jun-26 (F) | Jul-26 (F) | Aug-26 (F) | Sep-26 (P) | Oct-26 (P) |
| ALL COMMODITIES | 100.00000 | 109.9 | 110.0 | 109.9 | 110.7 | 112.5 | 113.3 |
| AGRICULTURE, FORESTRY AND FISHING | 22.15648 | 112.1 | 114.1 | 115.6 | 115.7 | 118.7 | 119.1 |
| Crop and Animal Production, Hunting and Related Service Activities | 19.03219 | 111.9 | 114.2 | 116.1 | 116.3 | 119.9 | 120.2 |
| Forestry and Logging | 1.67481 | 118.8 | 119.6 | 119.9 | 119.9 | 120.9 | 121.3 |
| Fishing and Aquaculture | 1.44948 | 106.9 | 106.6 | 103.7 | 102.9 | 100.0 | 102.5 |
| MINING AND QUARRYING | 3.42065 | 124.6 | 120.5 | 120.1 | 122.0 | 129.2 | 130.7 |
| Mining of Metal Ores | 0.70792 | 180.1 | 179.5 | 177.6 | 179.3 | 182.2 | 180.4 |
| Mining of Coal and Lignite | 0.7398 | 86.6 | 87.9 | 88.4 | 90.5 | 95.1 | 96.9 |
| Other Mining and Quarrying | 1.23208 | 108.5 | 110.0 | 112.7 | 111.3 | 111.4 | 110.9 |
| Extraction of Crude Petroleum and Natural Gas | 0.74085 | 136.2 | 114.2 | 108.9 | 116.3 | 142.2 | 149.9 |
| MANUFACTURED PRODUCTS | 69.93568 | 109.7 | 109.4 | 108.7 | 109.8 | 111.0 | 111.7 |
| (A). Manufacture of Food Products | 8.47196 | 112.5 | 113.7 | 115.4 | 117.1 | 117.7 | 117.8 |
| (B). Manufacture of Beverages | 0.8417 | 105.0 | 105.2 | 104.7 | 105.4 | 106.0 | 106.2 |
| (C). Manufacture of Tobacco Products | 0.25705 | 125.6 | 128.3 | 128.4 | 128.4 | 127.1 | 128.5 |
| (D). Manufacture of Textiles | 4.38774 | 103.9 | 105.3 | 105.7 | 106.0 | 108.0 | 107.9 |
| (E). Manufacture of Wearing Apparel | 1.20494 | 110.8 | 111.0 | 110.9 | 111.2 | 112.0 | 111.8 |
| (F). Manufacture of Leather and Related Products | 0.49989 | 107.1 | 107.4 | 107.1 | 107.0 | 107.4 | 107.4 |
| (G). Manufacture of Wood and Products of Wood and Cork, except Furniture; Manufacture of Articles of Straw and Plaiting Materials | 1.08949 | 113.2 | 113.6 | 113.9 | 113.7 | 113.6 | 113.8 |
| (H). Manufacture of Paper and Paper Products | 1.03128 | 94.5 | 94.1 | 94.8 | 95.3 | 96.4 | 97.5 |
| (I). Printing and Reproduction of Recorded Media | 0.30931 | 109.5 | 109.5 | 109.6 | 109.6 | 110.6 | 110.0 |
| (J). Manufacture of Coke and Refined Petroleum Products | 7.14818 | 125.2 | 122.3 | 112.7 | 117.8 | 118.8 | 124.2 |
| (K). Manufacture of Chemicals and Chemical Products | 5.74793 | 104.1 | 104.3 | 103.1 | 104.4 | 106.3 | 106.8 |
| (L). Manufacture of Basic Pharmaceuticals, Medicinal Chemical and Botanical Products | 1.92807 | 103.6 | 103.7 | 104.2 | 103.7 | 104.7 | 103.9 |
| (M). Manufacture of Rubber and Plastic Products | 2.57252 | 107.0 | 107.4 | 107.3 | 107.8 | 109.5 | 109.9 |
| (N). Manufacture of Other Non-Metallic Mineral Products | 2.50437 | 99.1 | 99.8 | 100.1 | 99.8 | 100.4 | 100.2 |
| (O). Manufacture of Basic Metals | 7.465 | 104.3 | 101.0 | 101.8 | 102.4 | 105.7 | 106.6 |
| (P). Manufacture of Fabricated Metal Products, except Machinery and Equipment | 3.15198 | 103.3 | 103.3 | 103.9 | 104.1 | 104.9 | 105.0 |
| (Q). Manufacture of Computer, Electronic and Optical Products | 1.7748 | 104.9 | 104.7 | 105.0 | 105.5 | 105.8 | 106.0 |
| (R). Manufacture of Electrical Equipment | 3.81453 | 107.2 | 107.9 | 108.3 | 108.8 | 109.6 | 109.4 |
| (S). Manufacture of Machinery and Equipment n.e.c. | 2.46158 | 105.7 | 105.6 | 106.4 | 106.3 | 106.9 | 106.9 |
| (T). Manufacture of Motor Vehicles, Trailers and Semi-Trailers | 4.39321 | 107.2 | 108.5 | 108.9 | 109.4 | 109.9 | 110.2 |
| (U). Manufacture of Other Transport Equipment | 1.34392 | 107.6 | 108.5 | 109.3 | 109.4 | 110.2 | 110.0 |
| (V). Manufacture of Furniture | 0.73566 | 104.9 | 104.7 | 104.8 | 104.6 | 105.0 | 105.7 |
| (W). Other Manufacturing | 6.80057 | 122.2 | 121.5 | 120.7 | 121.0 | 122.8 | 121.7 |
| ELECTRICITY | 4.48719 | 91.6 | 91.2 | 91.8 | 91.4 | 92.0 | 96.5 |
| Electricity | 4.48719 | 91.6 | 91.2 | 91.8 | 91.4 | 92.0 | 96.5 |
(P)-Provisional, (F)-Final
Annexure-VI
Cumulative Output PPI for All Commodities, Major Groups and Groups
Groups/Major Groups | Weight | Apr-Oct FY 2023-24 | Apr-Oct FY 2024-25 | Apr-Oct FY 2025-26 | Apr-Oct FY 2026-27 |
| ALL COMMODITIES | 100.00000 | 99.1 | 100.6 | 100.6 | 110.7 |
| AGRICULTURE, FORESTRY AND FISHING | 22.15648 | 105.5 | 111.2 | 108.1 | 115.2 |
| Crop and Animal Production, Hunting and Related Service Activities | 19.03219 | 105.8 | 111.7 | 108.3 | 115.7 |
| Forestry and Logging | 1.67481 | 103.8 | 113.5 | 111.8 | 119.6 |
| Fishing and Aquaculture | 1.44948 | 102.8 | 101.7 | 100.8 | 103.7 |
| MINING AND QUARRYING | 3.42065 | 99.2 | 105.6 | 105.0 | 124.6 |
| Mining of Metal Ores | 0.70792 | 103.5 | 124.6 | 144.2 | 179.1 |
| Mining of Coal and Lignite | 0.7398 | 92.8 | 90.0 | 88.5 | 90.4 |
| Other Mining and Quarrying | 1.23208 | 103.2 | 110.4 | 105.2 | 110.7 |
| Extraction of Crude Petroleum and Natural Gas | 0.74085 | 94.9 | 95.1 | 83.6 | 129.8 |
| MANUFACTURED PRODUCTS | 69.93568 | 97.4 | 97.5 | 98.6 | 109.8 |
| (A). Manufacture of Food Products | 8.47196 | 97.7 | 101.3 | 106.5 | 115.0 |
| (B). Manufacture of Beverages | 0.8417 | 102.4 | 104.0 | 104.1 | 105.3 |
| (C). Manufacture of Tobacco Products | 0.25705 | 104.3 | 106.9 | 109.8 | 127.4 |
| (D). Manufacture of Textiles | 4.38774 | 92.9 | 92.8 | 92.6 | 105.4 |
| (E). Manufacture of Wearing Apparel | 1.20494 | 102.1 | 104.1 | 107.6 | 111.1 |
| (F). Manufacture of Leather and Related Products | 0.49989 | 101.0 | 101.1 | 103.0 | 107.0 |
| (G). Manufacture of Wood and Products of Wood and Cork, except Furniture; Manufacture of Articles of Straw and Plaiting Materials | 1.08949 | 102.0 | 103.2 | 106.7 | 113.6 |
| (H). Manufacture of Paper and Paper Products | 1.03128 | 90.3 | 90.3 | 91.3 | 95.2 |
| (I). Printing and Reproduction of Recorded Media | 0.30931 | 104.3 | 104.8 | 105.7 | 109.7 |
| (J). Manufacture of Coke and Refined Petroleum Products | 7.14818 | 90.7 | 89.1 | 85.1 | 120.3 |
| (K). Manufacture of Chemicals and Chemical Products | 5.74793 | 93.0 | 91.4 | 91.1 | 104.6 |
| (L). Manufacture of Basic Pharmaceuticals, Medicinal Chemical and Botanical Products | 1.92807 | 101.5 | 99.3 | 100.2 | 103.9 |
| (M). Manufacture of Rubber and Plastic Products | 2.57252 | 95.4 | 96.3 | 96.3 | 107.9 |
| (N). Manufacture of Other Non-Metallic Mineral Products | 2.50437 | 99.2 | 95.5 | 96.7 | 99.8 |
| (O). Manufacture of Basic Metals | 7.465 | 94.6 | 92.9 | 91.0 | 103.5 |
| (P). Manufacture of Fabricated Metal Products, except Machinery and Equipment | 3.15198 | 98.8 | 99.1 | 98.3 | 103.8 |
| (Q). Manufacture of Computer, Electronic and Optical Products | 1.7748 | 98.2 | 97.1 | 106.4 | 105.2 |
| (R). Manufacture of Electrical Equipment | 3.81453 | 99.4 | 99.6 | 101.0 | 108.1 |
| (S). Manufacture of Machinery and Equipment n.e.c. | 2.46158 | 102.1 | 102.6 | 103.5 | 106.2 |
| (T). Manufacture of Motor Vehicles, Trailers and Semi-Trailers | 4.39321 | 104.4 | 106.1 | 105.9 | 108.8 |
| (U). Manufacture of Other Transport Equipment | 1.34392 | 101.8 | 101.5 | 104.1 | 108.9 |
| (V). Manufacture of Furniture | 0.73566 | 101.5 | 101.3 | 101.4 | 105.0 |
| (W). Other Manufacturing | 6.80057 | 101.3 | 102.6 | 108.2 | 121.5 |
| ELECTRICITY | 4.48719 | 94.9 | 93.1 | 91.9 | 92.2 |
| Electricity | 4.48719 | 94.9 | 93.1 | 91.9 | 92.2 |
Note: Cumulative Index has been calculated by taking Arithmetic Mean of 7 months indices
Provisional Trial Input Producer Price Index (IPPI) (Base Year 2022-23) for the month of October 2026
1. All India trial Input PPI for Manufacturing Sector for October 2026 stands at 108.2 (Provisional).
2. Trial Input PPI for Manufacturing Sector for the month of August 2026 has been revised from 104.2 (provisional) to 105.1 (final).
3. Trial Input PPI for all Manufacturing Industries at NIC-2-digit, from May to October 2026 is given below.
Trial Input PPI for all Manufacturing Industries at NIC-2-digit
Industry Group | Weight | May-26 (F) | Jun-26 (F) | Jul-26 (F) | Aug-26 (F) | Sep-26 (P) | Oct-26 (P) |
| Manufacturing Sector | 100.000000 | 106.5 | 105.9 | 105.5 | 105.1 | 106.1 | 108.2 |
| (A). Manufacture of Food Products | 14.84638 | 110.5 | 112.1 | 113.5 | 114.6 | 115.3 | 116.4 |
| (B). Manufacture of Beverages | 1.03035 | 105.4 | 105.5 | 106.5 | 107.7 | 108.8 | 110.1 |
| (C). Manufacture of Tobacco Products | 0.26443 | 122.5 | 123.5 | 125.7 | 125.2 | 125.8 | 126.8 |
| (D). Manufacture of Textiles | 5.88918 | 103.4 | 103.8 | 104.0 | 104.1 | 104.9 | 105.8 |
| (E). Manufacture of Wearing Apparel | 1.57012 | 107.4 | 108.3 | 107.9 | 108.4 | 109.4 | 110.0 |
| (F). Manufacture of Leather and Related Products | 0.77634 | 97.9 | 97.1 | 98.6 | 98.2 | 99 | 98.7 |
| (G). Manufacture of Wood and Products of Wood and Cork, Except Furniture; Manufacture of Articles of Straw and Plaiting Materials | 1.82194 | 113.4 | 111.5 | 110.5 | 110.8 | 111.8 | 112.1 |
| (H). Manufacture of Paper and Paper Products | 0.87494 | 97.2 | 97.4 | 98.1 | 98.7 | 99.8 | 101.2 |
| (I). Printing and Reproduction of Recorded Media | 0.46606 | 98.9 | 98.8 | 99.1 | 99.1 | 97.6 | 99.0 |
| (J). Manufacture of Coke and Refined Petroleum Products | 12.3291 | 111.8 | 105.1 | 100.6 | 93.8 | 94.7 | 103.1 |
| (K). Manufacture of Chemicals and Chemical Products | 7.98919 | 110.5 | 110.7 | 109.9 | 110.8 | 113.4 | 114.5 |
| (L). Manufacture of Basic Pharmaceutical Products and Pharmaceutical Preparations | 2.40463 | 105.3 | 104.7 | 105.0 | 106.1 | 107.3 | 109.3 |
| (M). Manufacture of Rubber and Plastic Products | 3.40235 | 111.1 | 112.8 | 111.9 | 113.8 | 115.5 | 117.6 |
| (N). Manufacture of Other Non-Metallic Mineral Products | 3.28306 | 98.4 | 96.4 | 93.1 | 93.3 | 95.8 | 97.0 |
| (O). Manufacture of Basic Metals | 11.25229 | 102.2 | 101.6 | 101.6 | 102.0 | 103.4 | 104.8 |
| (P). Manufacture of Fabricated Metal Products, except Machinery and Equipment | 5.59239 | 104.7 | 105.7 | 105.7 | 105.8 | 106.9 | 108.1 |
| (Q). Manufacture of Computer, Electronic and Optical Products | 2.22964 | 107.0 | 108.9 | 109.8 | 108.7 | 108.8 | 109.3 |
| (R). Manufacture of Electrical Equipment | 3.64437 | 116.2 | 117.5 | 117.6 | 118.6 | 120.2 | 121.0 |
| (S). Manufacture of Machinery and Equipment n.e.c. | 5.07784 | 105.4 | 105.0 | 105.2 | 105.2 | 104.5 | 106.7 |
| (T). Manufacture of Motor Vehicles, Trailers and Semi-Trailers, and Manufacture of Other Transport Equipment | 10.49446 | 103.7 | 104.0 | 104.8 | 105.1 | 106.3 | 106.8 |
| (U). Manufacture of Furniture | 0.98353 | 100.7 | 100.5 | 101.9 | 101.2 | 102 | 102.8 |
| (V). Other Manufacturing | 3.77741 | 89.5 | 87.3 | 87.7 | 86.8 | 86.2 | 89.0 |
(P)-Provisional, (F)-Final
Source: Click here to view/download PDF
नोट :- हमारे वेबसाइट indiangovtscheme.com पर ऐसी जानकारी रोजाना आती रहती है, तो आप ऐसी ही सरकारी योजनाओं की जानकारी पाने के लिए हमारे वेबसाइट indiangovtscheme.com से जुड़े रहे।